Copyright
©The Author(s) 2016.
World J Gastroenterol. Aug 7, 2016; 22(29): 6706-6715
Published online Aug 7, 2016. doi: 10.3748/wjg.v22.i29.6706
Published online Aug 7, 2016. doi: 10.3748/wjg.v22.i29.6706
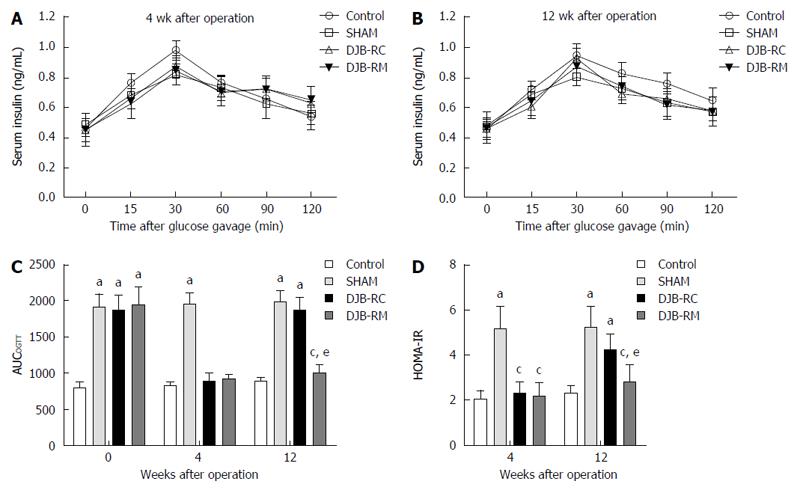
Figure 2 Serum insulin after oral glucose administration.
Shown are levels of serum insulin after oral glucose gavage (1 g/kg) at 4 wk (A) and 12 wk (B) after surgery, between which there are no significant differences with the use of mixed model one-way analysis of variance followed by Bonferroni post hoc comparisons. Area under the curves for oral glucose tolerance test and homeostasis model assessment of insulin resistance are demonstrated in C and D respectively. aP < 0.05 vs control group; cP < 0.05 vs sham group; eP < 0.05 vs DJB-RC group. DJB-RC: Duodenal-jejunal bypass recurrence group; DJB-RM: Duodenal-jejunal bypass-remission group.
- Citation: Zhong MW, Liu SZ, Zhang GY, Zhang X, Liu T, Hu SY. Alterations in gut microbiota during remission and recurrence of diabetes after duodenal-jejunal bypass in rats. World J Gastroenterol 2016; 22(29): 6706-6715
- URL: https://www.wjgnet.com/1007-9327/full/v22/i29/6706.htm
- DOI: https://dx.doi.org/10.3748/wjg.v22.i29.6706


