Copyright
©The Author(s) 2016.
World J Gastroenterol. Jul 21, 2016; 22(27): 6224-6234
Published online Jul 21, 2016. doi: 10.3748/wjg.v22.i27.6224
Published online Jul 21, 2016. doi: 10.3748/wjg.v22.i27.6224
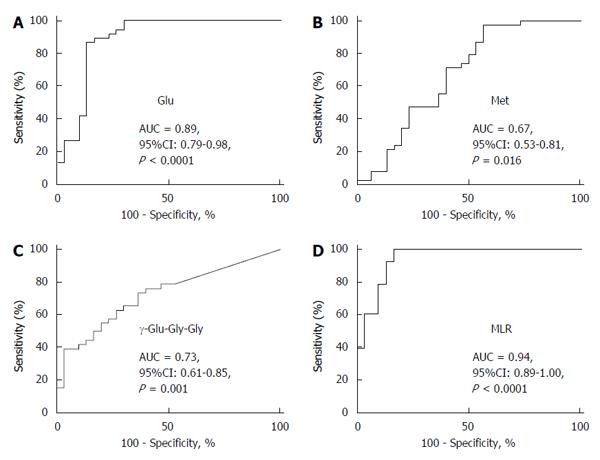
Figure 4 Area under the curve values for glutamic acid (A), methionine (B) and γ-glutamyl-glycine-glycine (C), and the multiple logistic regression model incorporating the concentrations of these three metabolites (D) for discriminating hepatitis B virus-related hepatocellular carcinoma from hepatitis C virus-related hepatocellular carcinoma by receiver operating characteristic analysis.
Glu: Glutamic acid; Met: Methionine; γ-Glu-Gly-Gly: γ-glutamyl-glycine-glycine; MLR: Multiple logistic regression; AUC: Area under the curve; HCC-B: Hepatitis B virus-related HCC; HCC-C: Hepatitis C virus-related HCC; HCC: Hepatocellular carcinoma.
- Citation: Saito T, Sugimoto M, Okumoto K, Haga H, Katsumi T, Mizuno K, Nishina T, Sato S, Igarashi K, Maki H, Tomita M, Ueno Y, Soga T. Serum metabolome profiles characterized by patients with hepatocellular carcinoma associated with hepatitis B and C. World J Gastroenterol 2016; 22(27): 6224-6234
- URL: https://www.wjgnet.com/1007-9327/full/v22/i27/6224.htm
- DOI: https://dx.doi.org/10.3748/wjg.v22.i27.6224


