Copyright
©The Author(s) 2016.
World J Gastroenterol. Jul 14, 2016; 22(26): 6057-6064
Published online Jul 14, 2016. doi: 10.3748/wjg.v22.i26.6057
Published online Jul 14, 2016. doi: 10.3748/wjg.v22.i26.6057
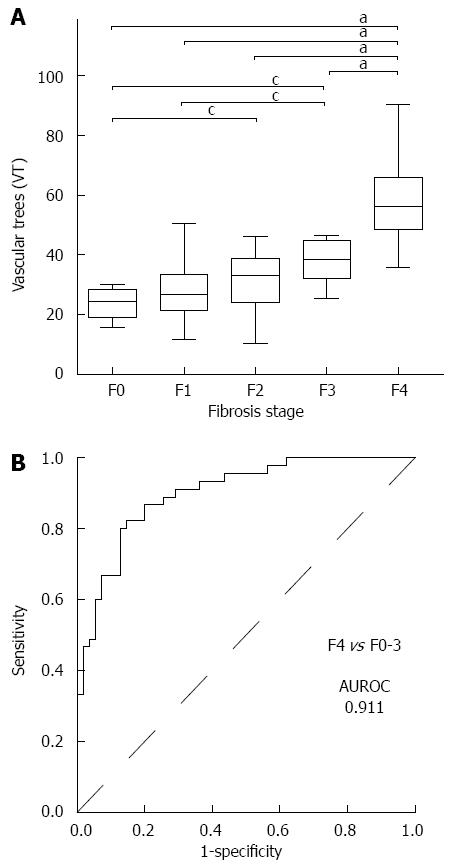
Figure 3 Vascular tree values for the different fibrosis stages in patients who underwent liver biopsy (A) and the receiver operating characteristic curve of the vascular tree for the prediction of F4 in all 100 patients.
The VT values increased in proportion to the fibrosis stage (aP < 0.001, cP < 0.01 by Kruskal-Wallis analysis). AUROC: Area under the receiver operating characteristic; VT: Vascular trees.
- Citation: Kuroda H, Abe T, Kakisaka K, Fujiwara Y, Yoshida Y, Miyasaka A, Ishida K, Ishida H, Sugai T, Takikawa Y. Visualizing the hepatic vascular architecture using superb microvascular imaging in patients with hepatitis C virus: A novel technique. World J Gastroenterol 2016; 22(26): 6057-6064
- URL: https://www.wjgnet.com/1007-9327/full/v22/i26/6057.htm
- DOI: https://dx.doi.org/10.3748/wjg.v22.i26.6057


