Copyright
©The Author(s) 2016.
World J Gastroenterol. Jul 14, 2016; 22(26): 6057-6064
Published online Jul 14, 2016. doi: 10.3748/wjg.v22.i26.6057
Published online Jul 14, 2016. doi: 10.3748/wjg.v22.i26.6057
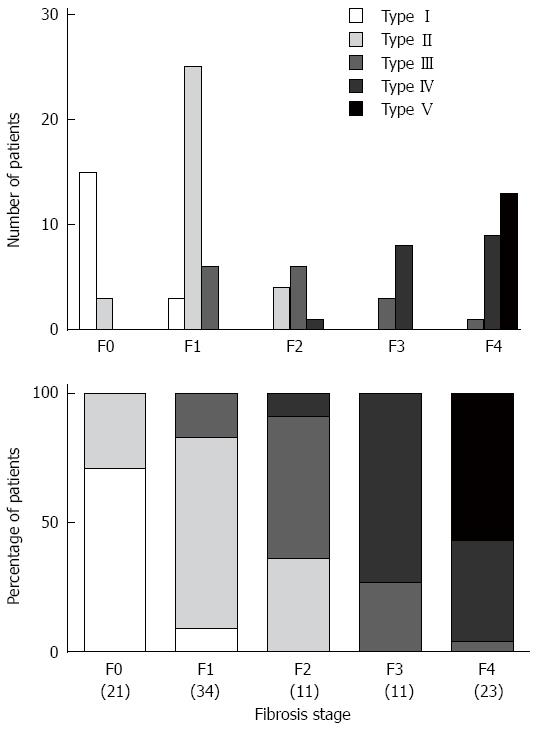
Figure 2 Distribution of the superb microvascular imaging patterns and fibrosis stages.
Fisher’s exact probability test demonstrated a significant difference in the SMI pattern distribution and the fibrosis stage (P < 0.001). SMI: Superb microvascular imaging.
- Citation: Kuroda H, Abe T, Kakisaka K, Fujiwara Y, Yoshida Y, Miyasaka A, Ishida K, Ishida H, Sugai T, Takikawa Y. Visualizing the hepatic vascular architecture using superb microvascular imaging in patients with hepatitis C virus: A novel technique. World J Gastroenterol 2016; 22(26): 6057-6064
- URL: https://www.wjgnet.com/1007-9327/full/v22/i26/6057.htm
- DOI: https://dx.doi.org/10.3748/wjg.v22.i26.6057


