Copyright
©The Author(s) 2016.
World J Gastroenterol. Jul 14, 2016; 22(26): 6016-6026
Published online Jul 14, 2016. doi: 10.3748/wjg.v22.i26.6016
Published online Jul 14, 2016. doi: 10.3748/wjg.v22.i26.6016
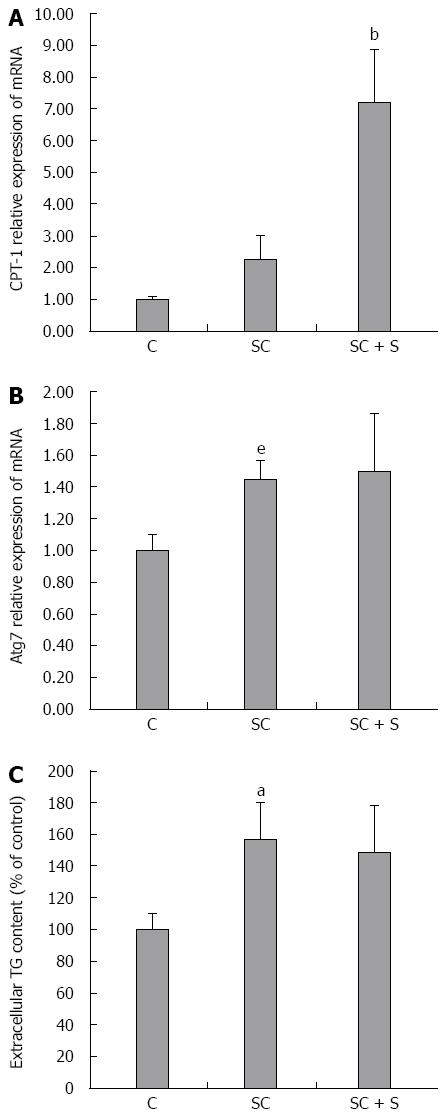
Figure 3 Effects of silybin on lipid catabolism pathways.
In control (C) and steatotic FaO cells incubated in the absence (SC) or in the presence (SC + S) of silybin 50 μmol/L we assessed: mRNA expression of CPT-1 (A) and of Atg7 (B) by qPCR; GAPDH was used as the internal control for quantifying gene expression and data expressed as fold induction with respect to controls; extracellular TG content quantified in the medium by spectrophotometric assay (C); data are expressed as percent TG content relative to control and normalized for total proteins; Values are mean ± SD from at least three independent experiments. ANOVA followed by Tukey’s test was used to assess the statistical significance between groups Significant differences are denoted by symbols: aP≤ 0.001, eP≤ 0.05 C vs OP and bP≤ 0.001, dP≤ 0.01 OP vs Slybin.
- Citation: Vecchione G, Grasselli E, Voci A, Baldini F, Grattagliano I, Wang DQ, Portincasa P, Vergani L. Silybin counteracts lipid excess and oxidative stress in cultured steatotic hepatic cells. World J Gastroenterol 2016; 22(26): 6016-6026
- URL: https://www.wjgnet.com/1007-9327/full/v22/i26/6016.htm
- DOI: https://dx.doi.org/10.3748/wjg.v22.i26.6016


