Copyright
©The Author(s) 2016.
World J Gastroenterol. Jun 28, 2016; 22(24): 5540-5547
Published online Jun 28, 2016. doi: 10.3748/wjg.v22.i24.5540
Published online Jun 28, 2016. doi: 10.3748/wjg.v22.i24.5540
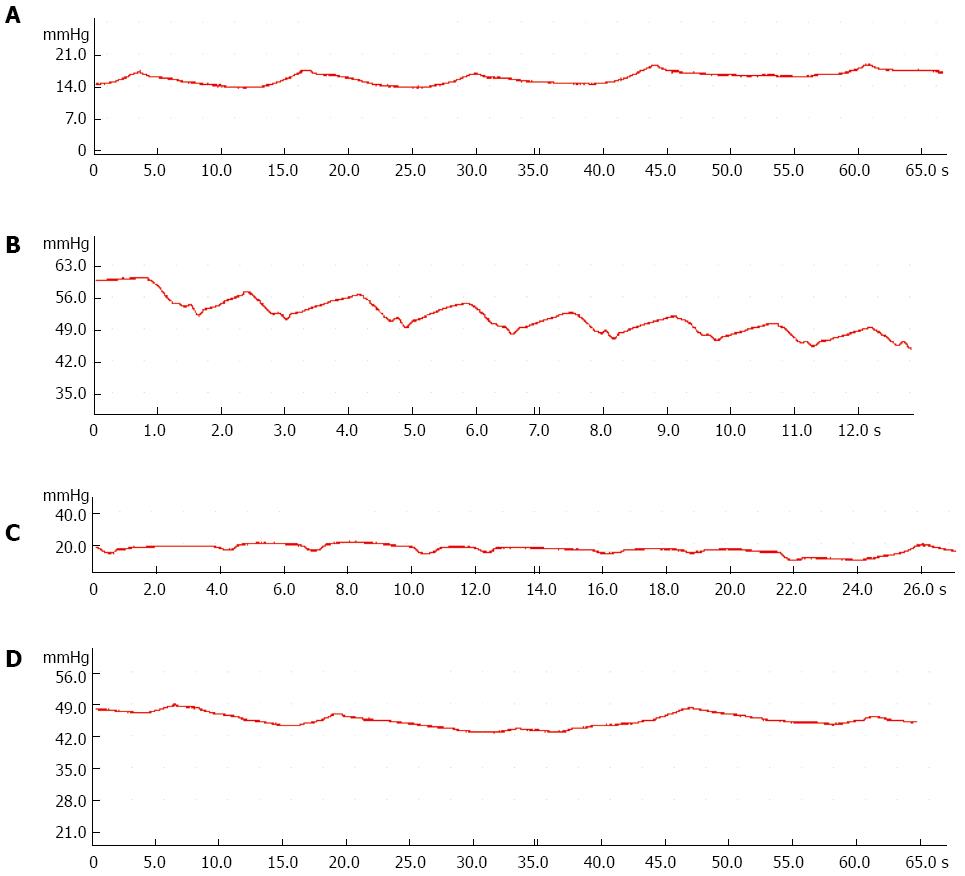
Figure 2 Sphincter of Oddi manometry analysis.
A: Sphincter of Oddi (SO) basal pressure in the control group; B: SO basal pressure in the 12 wk group; C: Common bile duct pressure in the control group; D: Common bile duct pressure in the 12 wk group.
- Citation: Rong ZH, Chen HY, Wang XX, Wang ZY, Xian GZ, Ma BZ, Qin CK, Zhang ZH. Effects of sphincter of Oddi motility on the formation of cholesterol gallstones. World J Gastroenterol 2016; 22(24): 5540-5547
- URL: https://www.wjgnet.com/1007-9327/full/v22/i24/5540.htm
- DOI: https://dx.doi.org/10.3748/wjg.v22.i24.5540


