Copyright
©The Author(s) 2016.
World J Gastroenterol. Jun 28, 2016; 22(24): 5520-5531
Published online Jun 28, 2016. doi: 10.3748/wjg.v22.i24.5520
Published online Jun 28, 2016. doi: 10.3748/wjg.v22.i24.5520
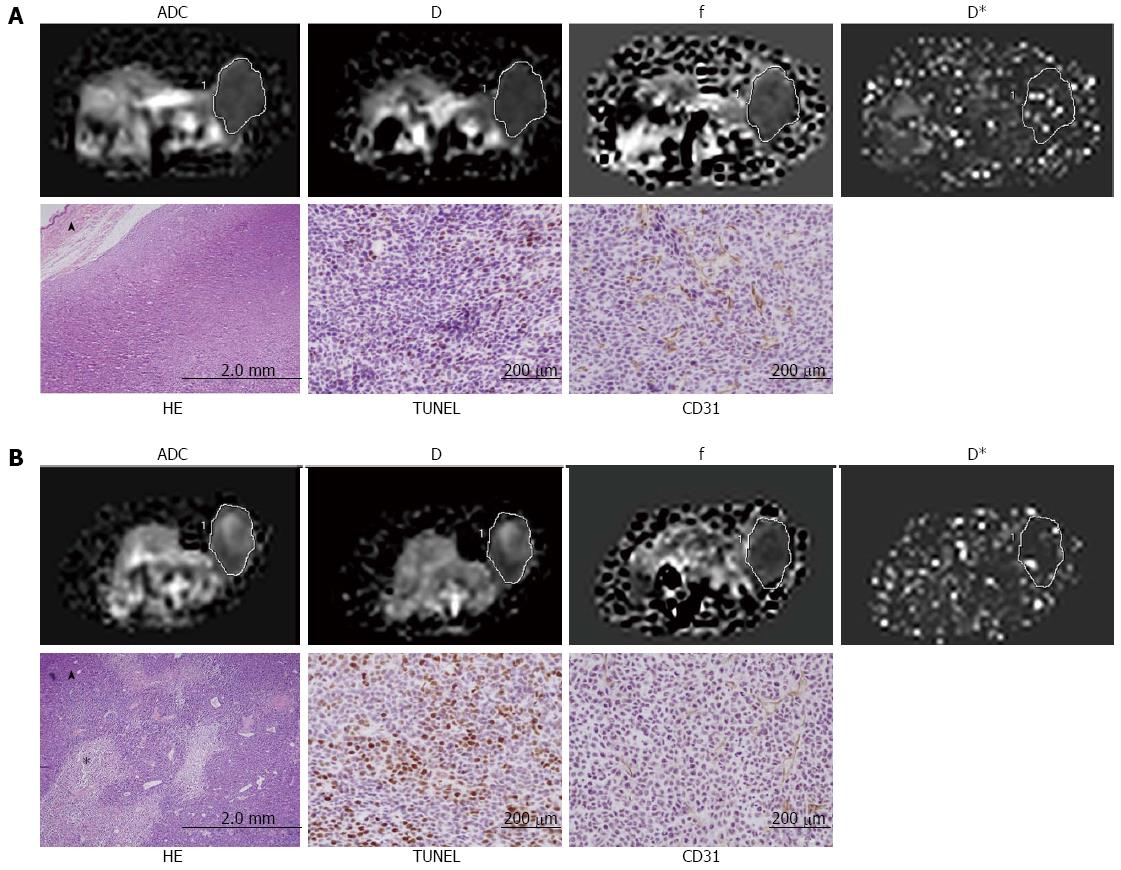
Figure 5 Calculated maps of intravoxel incoherent motion diffusion-weighted imaging parameters and the histopathological images.
A: The lower ADC (0.521 × 10⁻³ mm2/s) and D values (0.475 × 10⁻³ mm2/s) and the higher f (40.92%) and D* (0.131 mm2/s) values, which correspond to low necrosis (10%) and cellular apoptosis (7%) and high MVD (36) in the control group; B: Increased ADC (0.875 × 10⁻³ mm2/s) and D (0.851 × 10⁻³ mm2/s) values and reduced f (17.20%) and D* (0.098 mm2/s) values, which correspond to the increased necrosis (18%) and cellular apoptosis (23%) and decreased MVD (17) in the 3-d treatment group. Note high signal intensity within tumor suggesting necrosis. asterisk means necrosis area; The triangle symbol means skin of the mouse. ADC: Apparent diffusion coefficient; MVD: Microvessel density.
- Citation: Song XL, Kang HK, Jeong GW, Ahn KY, Jeong YY, Kang YJ, Cho HJ, Moon CM. Intravoxel incoherent motion diffusion-weighted imaging for monitoring chemotherapeutic efficacy in gastric cancer. World J Gastroenterol 2016; 22(24): 5520-5531
- URL: https://www.wjgnet.com/1007-9327/full/v22/i24/5520.htm
- DOI: https://dx.doi.org/10.3748/wjg.v22.i24.5520


