Copyright
©The Author(s) 2016.
World J Gastroenterol. Jun 28, 2016; 22(24): 5520-5531
Published online Jun 28, 2016. doi: 10.3748/wjg.v22.i24.5520
Published online Jun 28, 2016. doi: 10.3748/wjg.v22.i24.5520
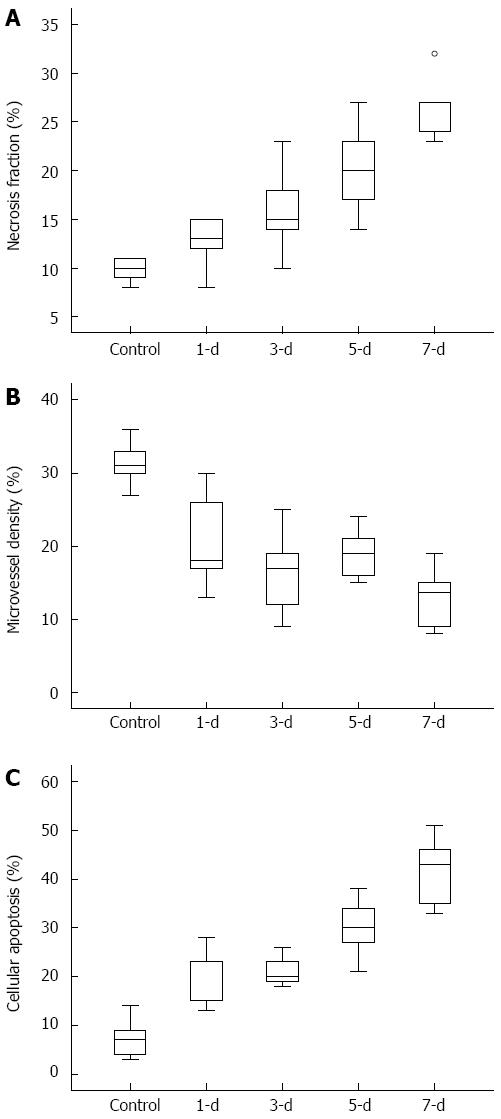
Figure 3 Box-and-Whisker plots show the results of histopathological analysis in the control and the 1-, 3-, 5- and 7-d treatment groups, respectively (n = 5 per group).
A: Necrosis fraction of tumor; B: Microvessel density of tumor; C: Cellular apoptosis of tumor. Center line = median; upper and lower margins of box = 25th to the 75th percentile, respectively; whiskers = data from the minimum to the maximum; ○ = outlier.
- Citation: Song XL, Kang HK, Jeong GW, Ahn KY, Jeong YY, Kang YJ, Cho HJ, Moon CM. Intravoxel incoherent motion diffusion-weighted imaging for monitoring chemotherapeutic efficacy in gastric cancer. World J Gastroenterol 2016; 22(24): 5520-5531
- URL: https://www.wjgnet.com/1007-9327/full/v22/i24/5520.htm
- DOI: https://dx.doi.org/10.3748/wjg.v22.i24.5520


