Copyright
©The Author(s) 2016.
World J Gastroenterol. Jun 28, 2016; 22(24): 5520-5531
Published online Jun 28, 2016. doi: 10.3748/wjg.v22.i24.5520
Published online Jun 28, 2016. doi: 10.3748/wjg.v22.i24.5520
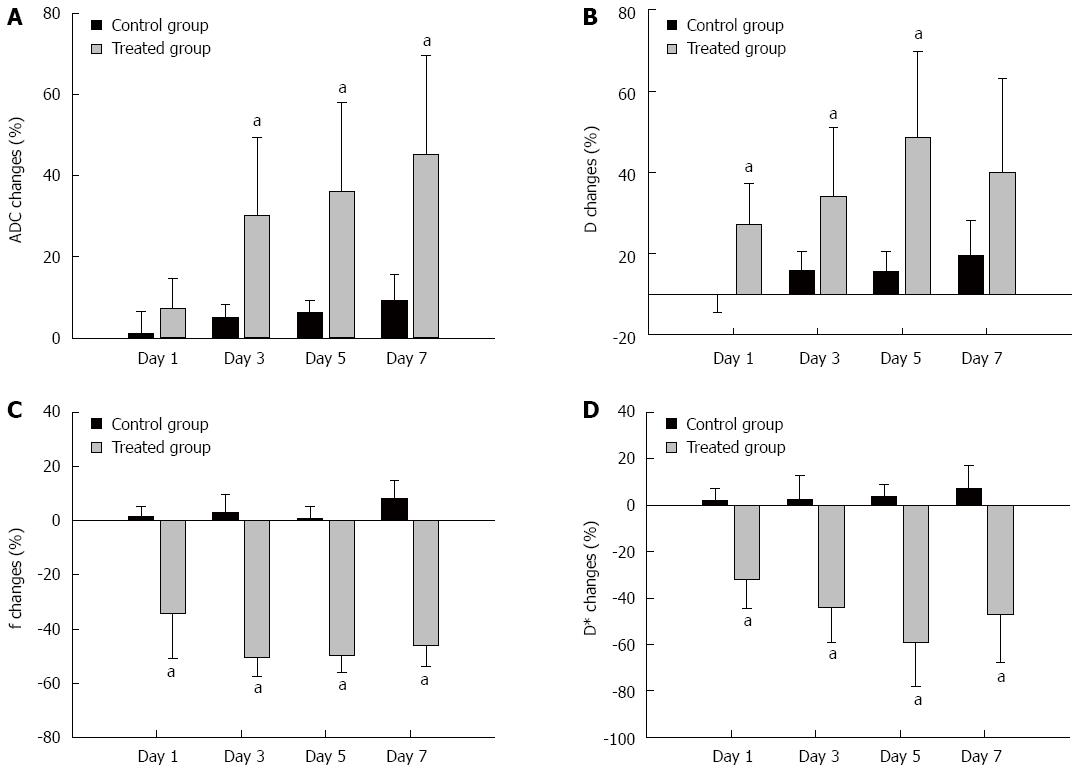
Figure 2 Comparison of the mean percentage changes from baseline in the intravoxel incoherent motion diffusion-weighted imaging derived values between the control (dark) and the 1-, 3-, 5- and 7-d treatment groups (grey).
A: ADC value; B: D value; C: f value; D: D* value. Standard deviations are represented by vertical bars. Relative changes were determined by comparing the values at baseline and those in follow-up. aP < 0.05 vs control. n = 5 in each group. ADC: Apparent diffusion coefficient.
- Citation: Song XL, Kang HK, Jeong GW, Ahn KY, Jeong YY, Kang YJ, Cho HJ, Moon CM. Intravoxel incoherent motion diffusion-weighted imaging for monitoring chemotherapeutic efficacy in gastric cancer. World J Gastroenterol 2016; 22(24): 5520-5531
- URL: https://www.wjgnet.com/1007-9327/full/v22/i24/5520.htm
- DOI: https://dx.doi.org/10.3748/wjg.v22.i24.5520


