Copyright
©The Author(s) 2016.
World J Gastroenterol. Jun 21, 2016; 22(23): 5353-5363
Published online Jun 21, 2016. doi: 10.3748/wjg.v22.i23.5353
Published online Jun 21, 2016. doi: 10.3748/wjg.v22.i23.5353
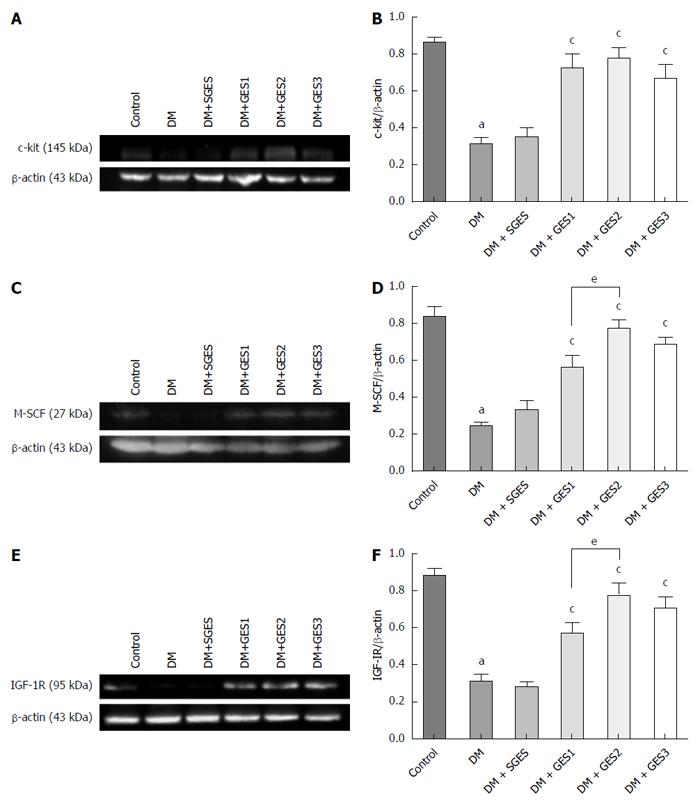
Figure 5 Expression levels of related proteins quantified by Western blot.
A, B: The expression of c-kit in different groups; C, D: The expression of M-SCF in different groups; E, F: The expression of IGF-1R in different groups. aP < 0.05 vs control; cP < 0.05 vs DM (diabetic group) group; eP < 0.05, DM + GES1 (GES parameter 1) vs DM + GES2 group. GES: Gastric electrical stimulation.
- Citation: Li H, Chen Y, Liu S, Hou XH. Long-pulse gastric electrical stimulation protects interstitial cells of Cajal in diabetic rats via IGF-1 signaling pathway. World J Gastroenterol 2016; 22(23): 5353-5363
- URL: https://www.wjgnet.com/1007-9327/full/v22/i23/5353.htm
- DOI: https://dx.doi.org/10.3748/wjg.v22.i23.5353


