Copyright
©The Author(s) 2016.
World J Gastroenterol. Jun 14, 2016; 22(22): 5285-5292
Published online Jun 14, 2016. doi: 10.3748/wjg.v22.i22.5285
Published online Jun 14, 2016. doi: 10.3748/wjg.v22.i22.5285
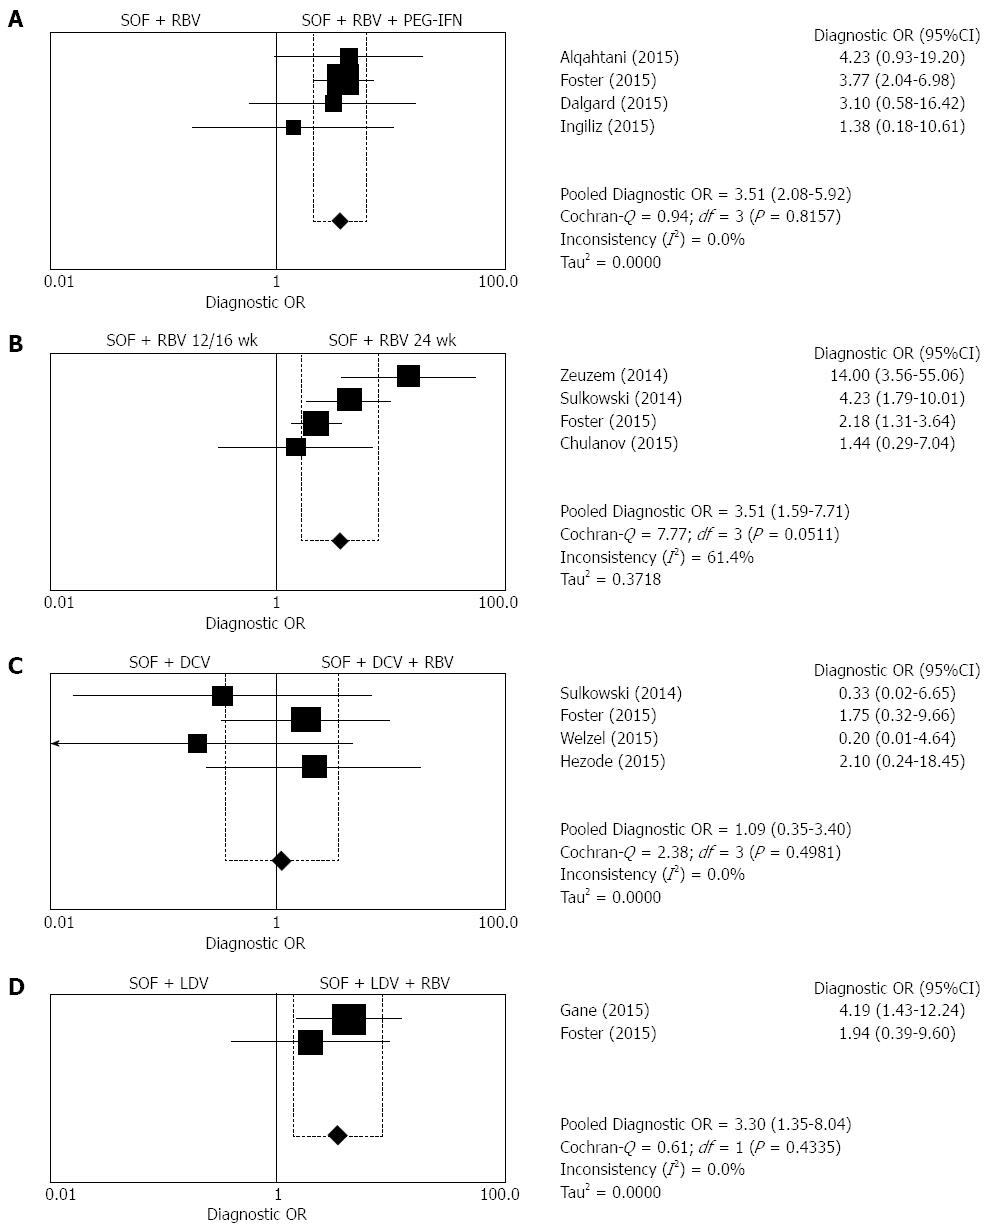
Figure 2 Odds ratio (95%CI) and Forest plot for SVR rates.
A: SOF + RBV + PEG-IFN vs SOF + RBV combinations; B: SOF + RBV 12 wk/16 wk vs SOF + RBV 24 wk combinations; C: SOF + RBV 12 wk/16 wk vs SOF + RBV 24 wk combinations; D: SOF + LDV vs SOF + LDV + RBV combinations.
- Citation: Ampuero J, Reddy KR, Romero-Gomez M. Hepatitis C virus genotype 3: Meta-analysis on sustained virologic response rates with currently available treatment options. World J Gastroenterol 2016; 22(22): 5285-5292
- URL: https://www.wjgnet.com/1007-9327/full/v22/i22/5285.htm
- DOI: https://dx.doi.org/10.3748/wjg.v22.i22.5285


