Copyright
©The Author(s) 2016.
World J Gastroenterol. Jun 14, 2016; 22(22): 5211-5227
Published online Jun 14, 2016. doi: 10.3748/wjg.v22.i22.5211
Published online Jun 14, 2016. doi: 10.3748/wjg.v22.i22.5211
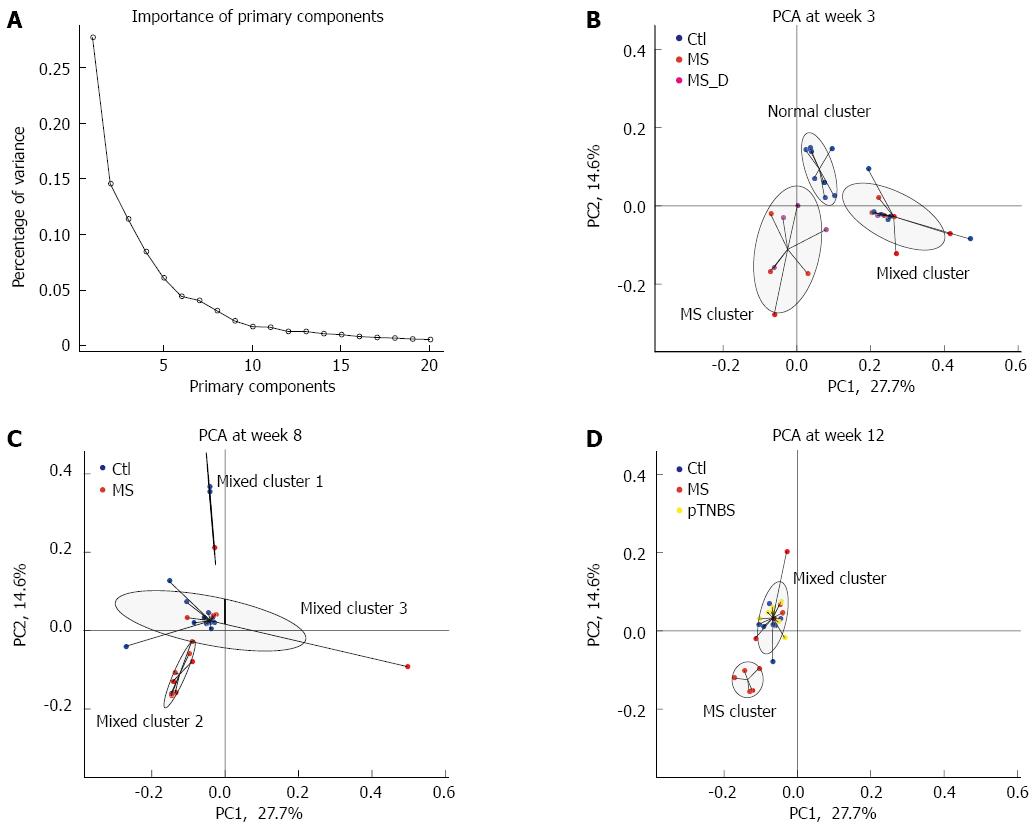
Figure 4 Primary component analysis and cluster analysis by time points.
Primary components were calculated from the relative abundance of all 2413 OTUs. A: The percentage of variances explained by the first 20 primary components. The primary component was separately plotted at week 3 (B), week 8 (C), and week 12 (D). The cluster analysis divided the samples into three clusters, and the samples in the same cluster were connected together. The ellipse was estimated to cover 75% of dots in this cluster. Each cluster was named according to the samples involved in this cluster. The MS group formed isolated clusters, indicated as “MS cluster”, at week 3 and week 12. MS: Maternal separation; PCA: Primary component analysis.
- Citation: Zhou XY, Li M, Li X, Long X, Zuo XL, Hou XH, Cong YZ, Li YQ. Visceral hypersensitive rats share common dysbiosis features with irritable bowel syndrome patients. World J Gastroenterol 2016; 22(22): 5211-5227
- URL: https://www.wjgnet.com/1007-9327/full/v22/i22/5211.htm
- DOI: https://dx.doi.org/10.3748/wjg.v22.i22.5211


