Copyright
©The Author(s) 2016.
World J Gastroenterol. Jun 14, 2016; 22(22): 5211-5227
Published online Jun 14, 2016. doi: 10.3748/wjg.v22.i22.5211
Published online Jun 14, 2016. doi: 10.3748/wjg.v22.i22.5211
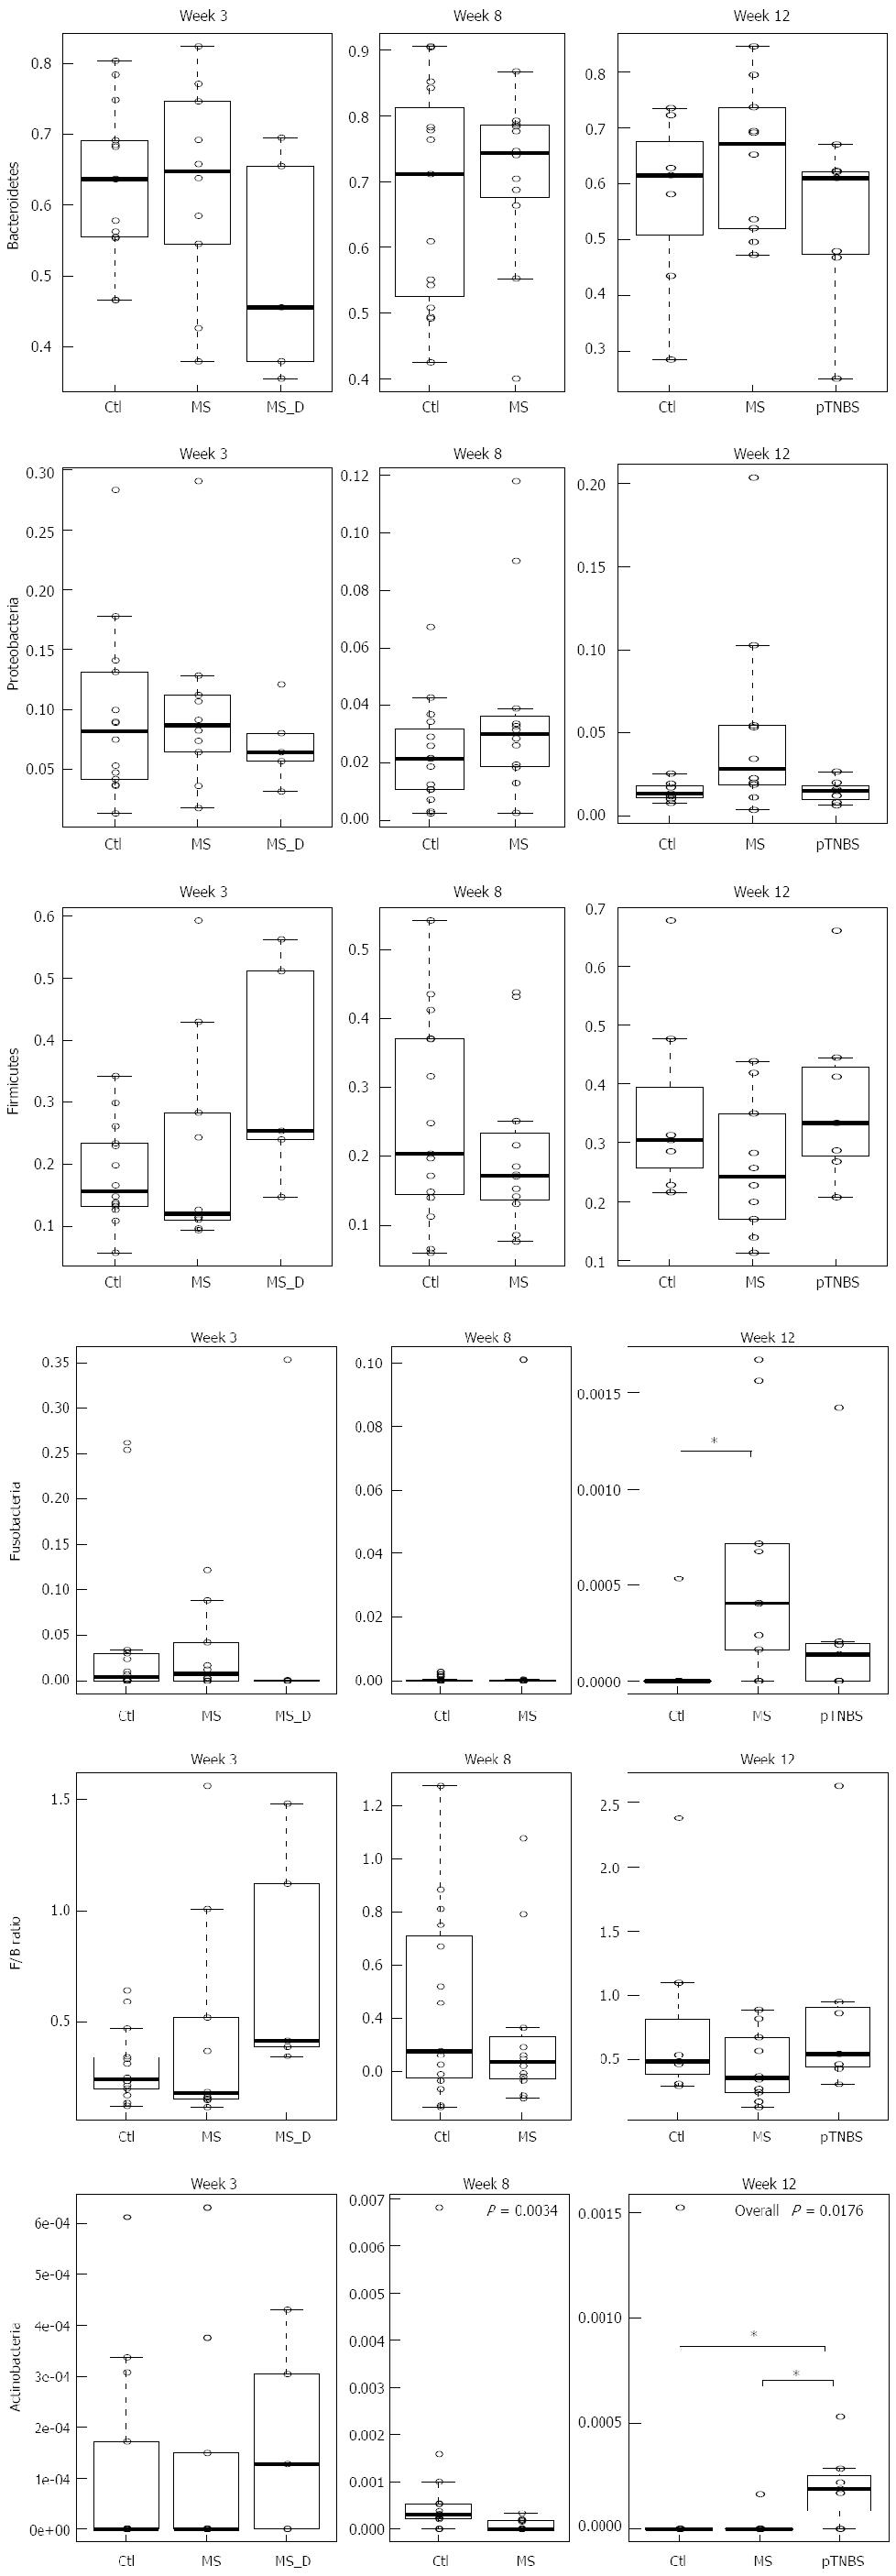
Figure 3 Phyla abundance by weeks 3, 8 and 12.
Asterisk indicates P < 0.05 in pairwise comparison. P > 0.05 (no significant), unless the P-value is drawn in the plot box. MS: Maternal separation; MS_D: MS early death; pTNBS: TNBS post-inflammatory.
- Citation: Zhou XY, Li M, Li X, Long X, Zuo XL, Hou XH, Cong YZ, Li YQ. Visceral hypersensitive rats share common dysbiosis features with irritable bowel syndrome patients. World J Gastroenterol 2016; 22(22): 5211-5227
- URL: https://www.wjgnet.com/1007-9327/full/v22/i22/5211.htm
- DOI: https://dx.doi.org/10.3748/wjg.v22.i22.5211


