Copyright
©The Author(s) 2016.
World J Gastroenterol. Jun 14, 2016; 22(22): 5201-5210
Published online Jun 14, 2016. doi: 10.3748/wjg.v22.i22.5201
Published online Jun 14, 2016. doi: 10.3748/wjg.v22.i22.5201
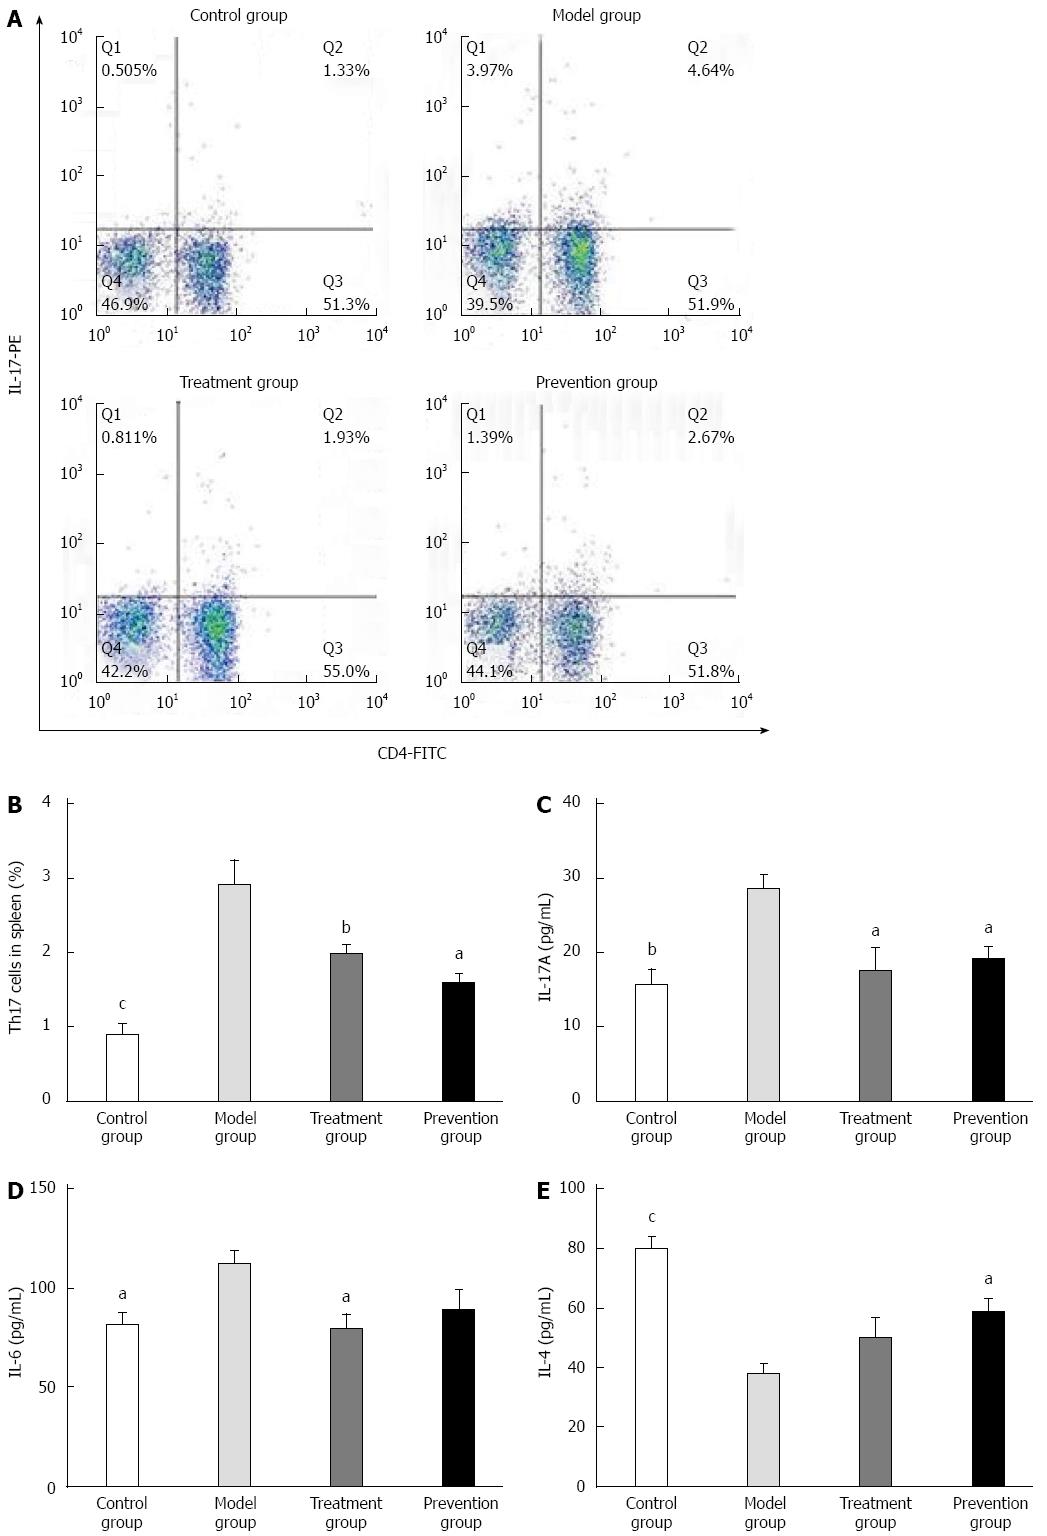
Figure 3 Proportion of Th17 cells in splenic mononuclear cells and plasma cytokines levels.
Flow cytometry figures (A) and statistical analysis (B) of Th17 cell in each group of the mice splenic MNC. Plasma IL-17 A (C), IL–6 (D) and IL-4 (E) levels by enzyme-linked immunosorbent assay. Data are the mean ± SD. n = 8-10. aP < 0.05, bP < 0.01, cP < 0.001 vs model group. IL: Interleukin; MNC: mononuclear cells.
- Citation: Huang XL, Zhang X, Fei XY, Chen ZG, Hao YP, Zhang S, Zhang MM, Yu YQ, Yu CG. Faecalibacterium prausnitzii supernatant ameliorates dextran sulfate sodium induced colitis by regulating Th17 cell differentiation. World J Gastroenterol 2016; 22(22): 5201-5210
- URL: https://www.wjgnet.com/1007-9327/full/v22/i22/5201.htm
- DOI: https://dx.doi.org/10.3748/wjg.v22.i22.5201


