Copyright
©The Author(s) 2016.
World J Gastroenterol. Jun 7, 2016; 22(21): 5122-5131
Published online Jun 7, 2016. doi: 10.3748/wjg.v22.i21.5122
Published online Jun 7, 2016. doi: 10.3748/wjg.v22.i21.5122
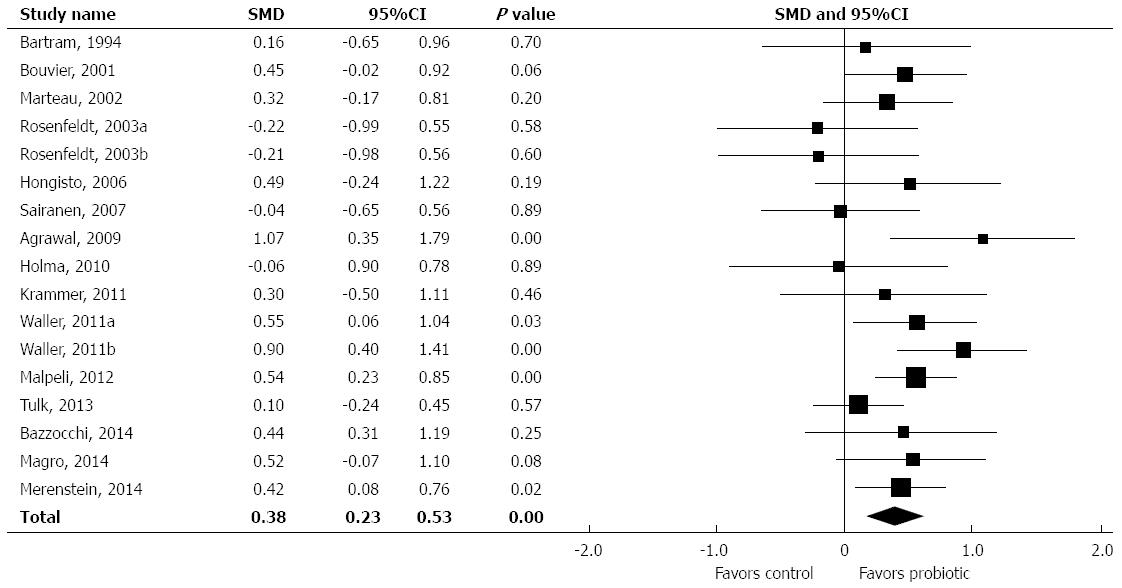
Figure 2 Forest plot of standardized mean difference in intestinal transit time across studies.
Random effects model. I2 = 20%, P = 0.22. SMD: Standardized mean difference.
- Citation: Miller LE, Zimmermann AK, Ouwehand AC. Contemporary meta-analysis of short-term probiotic consumption on gastrointestinal transit. World J Gastroenterol 2016; 22(21): 5122-5131
- URL: https://www.wjgnet.com/1007-9327/full/v22/i21/5122.htm
- DOI: https://dx.doi.org/10.3748/wjg.v22.i21.5122


