Copyright
©The Author(s) 2016.
World J Gastroenterol. Jun 7, 2016; 22(21): 5104-5113
Published online Jun 7, 2016. doi: 10.3748/wjg.v22.i21.5104
Published online Jun 7, 2016. doi: 10.3748/wjg.v22.i21.5104
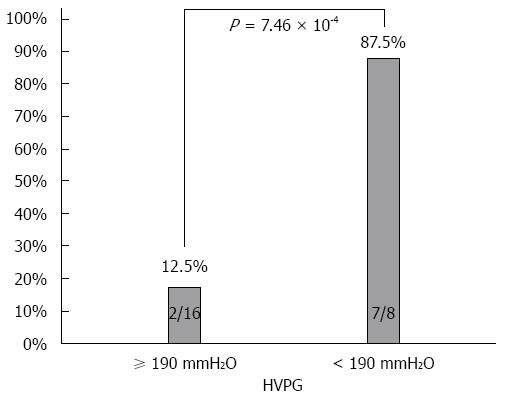
Figure 4 Difference in treatment response rates between patients with low and high hepatic venous pressure gradient.
The response rate of 87.5% in the latter with 190 mmH2O or greater was significantly higher than that of 12.5% in the former with less than 190 mmH2O (P = 7.46 × 10⁻⁴). HVPG: Hepatic venous pressure gradient.
- Citation: Nakagawa A, Atsukawa M, Tsubota A, Kondo C, Okubo T, Arai T, Itokawa N, Narahara Y, Iwakiri K. Usefulness of portal vein pressure for predicting the effects of tolvaptan in cirrhotic patients. World J Gastroenterol 2016; 22(21): 5104-5113
- URL: https://www.wjgnet.com/1007-9327/full/v22/i21/5104.htm
- DOI: https://dx.doi.org/10.3748/wjg.v22.i21.5104


