Copyright
©The Author(s) 2016.
World J Gastroenterol. Jun 7, 2016; 22(21): 5079-5087
Published online Jun 7, 2016. doi: 10.3748/wjg.v22.i21.5079
Published online Jun 7, 2016. doi: 10.3748/wjg.v22.i21.5079
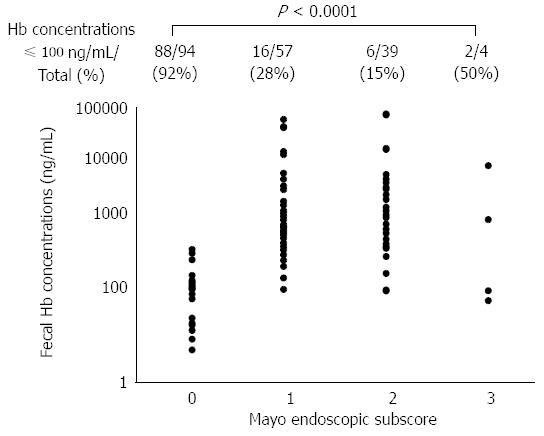
Figure 2 Correlation between fecal immunochemical test results and the Mayo endoscopic subscores.
There was a significant positive correlation between fecal hemoglobin concentrations and the MES (Spearman rank correlation coefficient = 0.6530, P < 0.0001). The proportion of cases with negative FIT results (fecal hemoglobin concentration ≤ 100 ng/mL) was greatest in cases with an MES of 0 (88/94, 92%). The proportion decreased gradually as the MES increased (MES 1: 16/57, 28%, MES 2: 6/39, 15%), and the trend of the decrease in relation to the MES was statistically significant (P < 0.0001, Cochran-Armitage trend test).
- Citation: Nakarai A, Kato J, Hiraoka S, Takashima S, Takei D, Inokuchi T, Sugihara Y, Takahara M, Harada K, Okada H. Ulcerative colitis patients in clinical remission demonstrate correlations between fecal immunochemical test results, mucosal healing, and risk of relapse. World J Gastroenterol 2016; 22(21): 5079-5087
- URL: https://www.wjgnet.com/1007-9327/full/v22/i21/5079.htm
- DOI: https://dx.doi.org/10.3748/wjg.v22.i21.5079


