Copyright
©The Author(s) 2016.
World J Gastroenterol. Jun 7, 2016; 22(21): 5042-5049
Published online Jun 7, 2016. doi: 10.3748/wjg.v22.i21.5042
Published online Jun 7, 2016. doi: 10.3748/wjg.v22.i21.5042
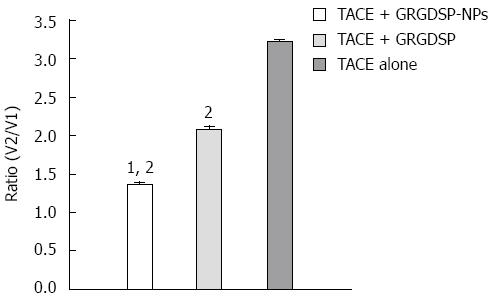
Figure 2 The mean tumor growth ratio (V2/V1) by magnetic resonance imaging from each group.
The mean tumor growth ratio (V2/V1) by MRI showed significant differences between group A (TACE + GRGDSP loaded nanoparticles), group B (control group 1, TACE + GRGDSP) and group C (control group 2, TACE alone) (P < 0.01). TACE: Transarterial chemoembolization. 1Compared with group B (control group 1, TACE + GRGDSP); 2Compared with group C (control group 2, TACE alone).
- Citation: Qian J, Oppermann E, Tran A, Imlau U, Qian K, Vogl TJ. Transarterial administration of integrin inhibitor loaded nanoparticles combined with transarterial chemoembolization for treating hepatocellular carcinoma in a rat model. World J Gastroenterol 2016; 22(21): 5042-5049
- URL: https://www.wjgnet.com/1007-9327/full/v22/i21/5042.htm
- DOI: https://dx.doi.org/10.3748/wjg.v22.i21.5042


