Copyright
©The Author(s) 2016.
World J Gastroenterol. Jun 7, 2016; 22(21): 5033-5041
Published online Jun 7, 2016. doi: 10.3748/wjg.v22.i21.5033
Published online Jun 7, 2016. doi: 10.3748/wjg.v22.i21.5033
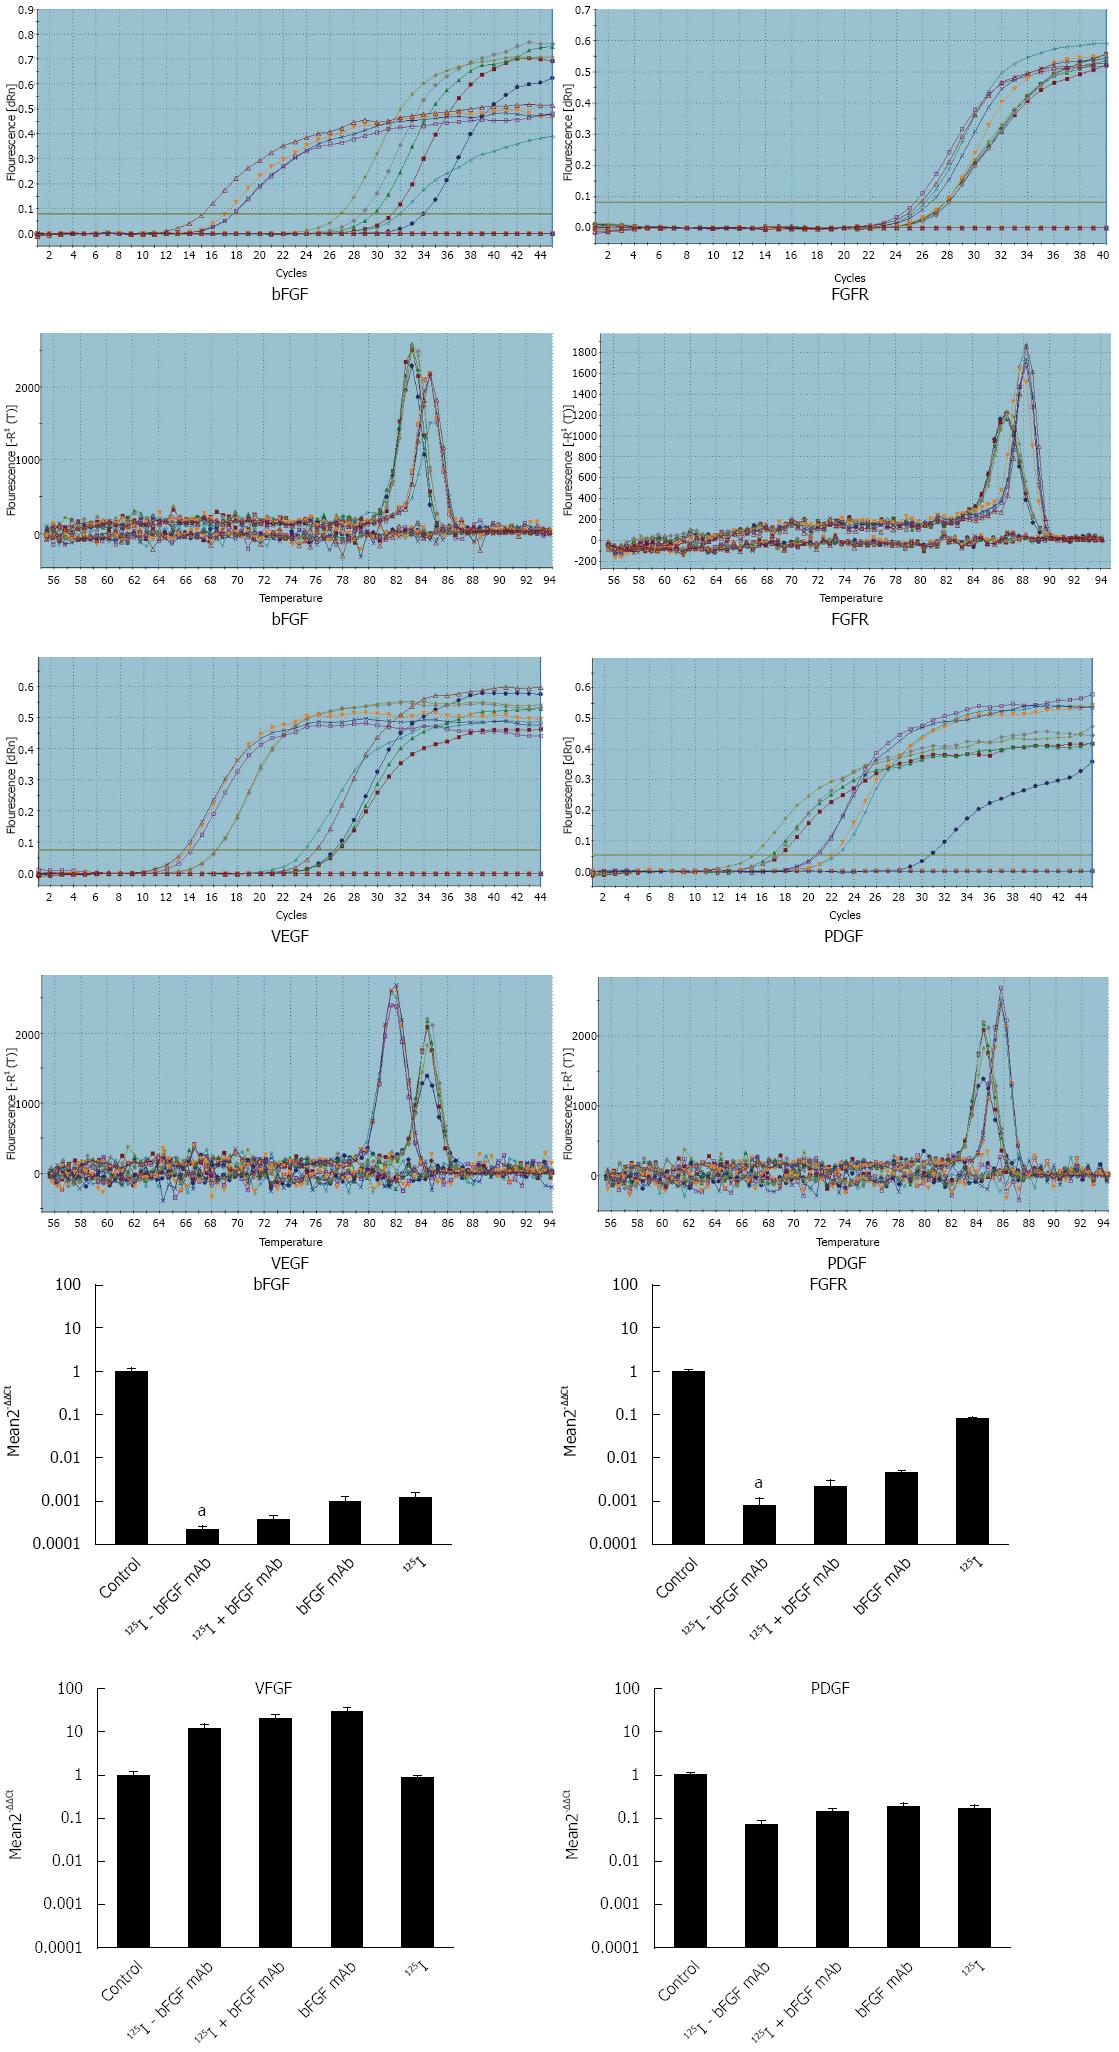
Figure 4 Quantitative real-time reverse transcriptase polymerase chain reaction amplification curves, melt curves and expression of bFGF, FGFR, VEGF and PDGF mRNA.
aP < 0.05, 125I-bFGF mAb group vs other groups (control, 125I, bFGF mAb and 125I plus bFGF mAb). qRT-PCR: Quantitative real-time reverse transcriptase polymerase chain reaction.
- Citation: Hu PH, Pan LH, Wong PTY, Chen WH, Yang YQ, Wang H, Xiang JJ, Xu M. 125I-labeled anti-bFGF monoclonal antibody inhibits growth of hepatocellular carcinoma. World J Gastroenterol 2016; 22(21): 5033-5041
- URL: https://www.wjgnet.com/1007-9327/full/v22/i21/5033.htm
- DOI: https://dx.doi.org/10.3748/wjg.v22.i21.5033


