Copyright
©The Author(s) 2016.
World J Gastroenterol. May 21, 2016; 22(19): 4685-4694
Published online May 21, 2016. doi: 10.3748/wjg.v22.i19.4685
Published online May 21, 2016. doi: 10.3748/wjg.v22.i19.4685
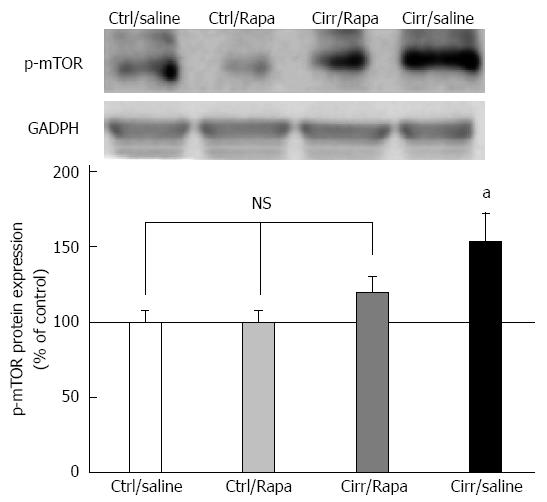
Figure 5 Western blot analysis of p-mammalian target of rapamycin protein in the left ventricles of control and CCl4-induced cirrhotic rats treated with normal saline or rapamycin (2 mg/kg).
The upper panels demonstrate the representative immunoblots of p-mTOR and glyceraldehyde 3 phosphate dehydrogenase (GAPDH) proteins in the control, control + rapamycin, cirrhotic and cirrhotic + rapamycin. The lower panel shows the densitometric analysis after normalization with GAPDH. Values are expressed as p-mTOR/GAPDH ratio (%) and normalized to the control group receiving normal saline (mean ± SD). aP < 0.05 vs the other three groups; NS: Non-significant.
- Citation: Saeedi Saravi SS, Ghazi-Khansari M, Ejtemaei Mehr S, Nobakht M, Mousavi SE, Dehpour AR. Contribution of mammalian target of rapamycin in the pathophysiology of cirrhotic cardiomyopathy. World J Gastroenterol 2016; 22(19): 4685-4694
- URL: https://www.wjgnet.com/1007-9327/full/v22/i19/4685.htm
- DOI: https://dx.doi.org/10.3748/wjg.v22.i19.4685


