Copyright
©The Author(s) 2016.
World J Gastroenterol. May 21, 2016; 22(19): 4685-4694
Published online May 21, 2016. doi: 10.3748/wjg.v22.i19.4685
Published online May 21, 2016. doi: 10.3748/wjg.v22.i19.4685
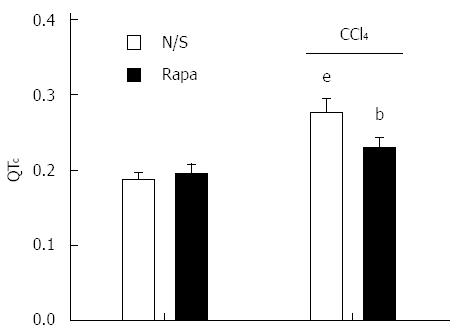
Figure 2 QT interval in control and CCl4-induced cirrhotic rats treated with normal saline or rapamycin (2 mg/kg).
QT intervals were defined as corrected QT (QTc) using Bazett’s formula. The data are expressed as the mean ± SD. eP < 0.001 vs control/normal saline group; bP < 0.01 vs control/rapamycin and cirrhotic/saline group.
- Citation: Saeedi Saravi SS, Ghazi-Khansari M, Ejtemaei Mehr S, Nobakht M, Mousavi SE, Dehpour AR. Contribution of mammalian target of rapamycin in the pathophysiology of cirrhotic cardiomyopathy. World J Gastroenterol 2016; 22(19): 4685-4694
- URL: https://www.wjgnet.com/1007-9327/full/v22/i19/4685.htm
- DOI: https://dx.doi.org/10.3748/wjg.v22.i19.4685


