Copyright
©The Author(s) 2016.
World J Gastroenterol. May 7, 2016; 22(17): 4362-4372
Published online May 7, 2016. doi: 10.3748/wjg.v22.i17.4362
Published online May 7, 2016. doi: 10.3748/wjg.v22.i17.4362
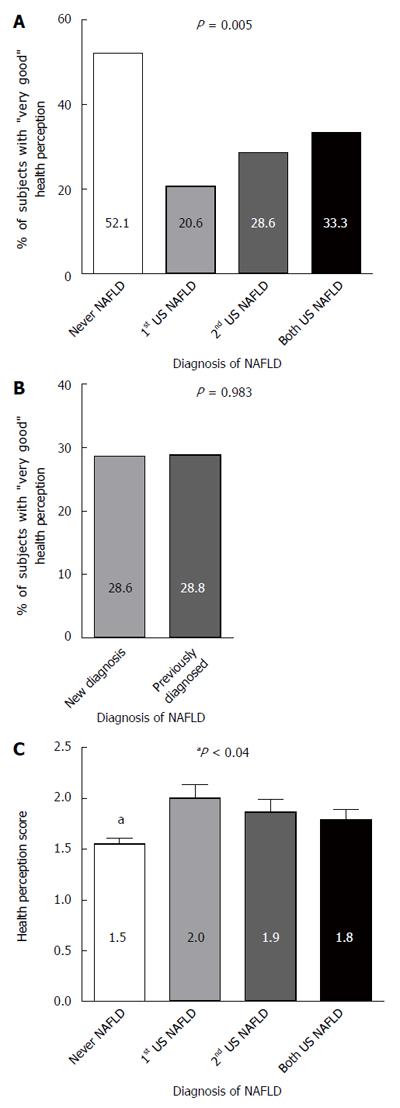
Figure 4 Health perception by past and present diagnosis of fatty liver on ultrasound (never NAFLD n = 119, 1st US NAFLD n = 24, 2nd US NAFLD n = 28, both US NAFLD n = 42).
A: Percent of subjects with “very good” health perception by NAFLD dynamics; B: Percent of subjects with “very good” health perception by naive (newly diagnosed) and not naive (previously diagnosed) NAFLD status; C: The average score of health perception by NAFLD dynamics (the lower the score the higher the health perception; 1 = “very good”, 4 = “not good at all”) (anever NAFLD vs every other group). NAFLD: Non-alcoholic fatty liver disease.
- Citation: Mlynarsky L, Schlesinger D, Lotan R, Webb M, Halpern Z, Santo E, Shibolet O, Zelber-Sagi S. Non-alcoholic fatty liver disease is not associated with a lower health perception. World J Gastroenterol 2016; 22(17): 4362-4372
- URL: https://www.wjgnet.com/1007-9327/full/v22/i17/4362.htm
- DOI: https://dx.doi.org/10.3748/wjg.v22.i17.4362


