Copyright
©The Author(s) 2016.
World J Gastroenterol. Apr 28, 2016; 22(16): 4238-4249
Published online Apr 28, 2016. doi: 10.3748/wjg.v22.i16.4238
Published online Apr 28, 2016. doi: 10.3748/wjg.v22.i16.4238
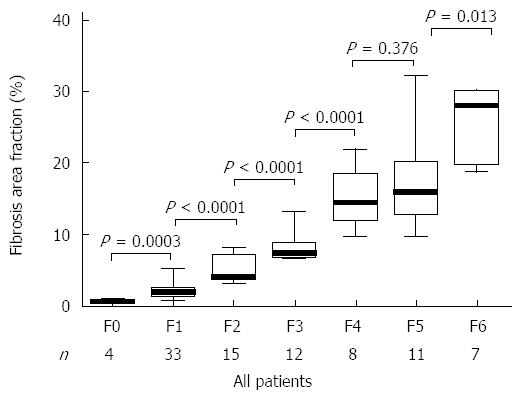
Figure 3 Distribution of fibrosis area fraction according to the categorical fibrosis scores.
Box-and-whiskers plot for liver stiffness measurement. The top and bottom of each box are the 75th and 25th percentiles. The line through the box is the median and the error bars are the maximum and minimum. The horizontal bar represents the significance between the designated groups.
- Citation: Behairy BES, Sira MM, Zalata KR, Salama ESE, Abd-Allah MA. Transient elastography compared to liver biopsy and morphometry for predicting fibrosis in pediatric chronic liver disease: Does etiology matter? World J Gastroenterol 2016; 22(16): 4238-4249
- URL: https://www.wjgnet.com/1007-9327/full/v22/i16/4238.htm
- DOI: https://dx.doi.org/10.3748/wjg.v22.i16.4238


