Copyright
©The Author(s) 2016.
World J Gastroenterol. Apr 28, 2016; 22(16): 4191-4200
Published online Apr 28, 2016. doi: 10.3748/wjg.v22.i16.4191
Published online Apr 28, 2016. doi: 10.3748/wjg.v22.i16.4191
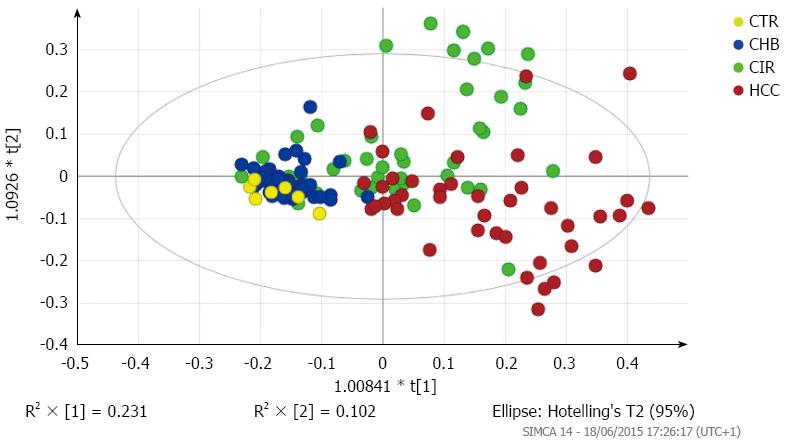
Figure 3 Scores plot of orthogonal partial least squares discriminant analysis (OPLS-DA) model of CTR, CHB, CIR, and HCC subgroups.
R2(X), R2(Y) and Q2 values were 0.468, 0.289, and 0.195, respectively.
- Citation: Cox IJ, Aliev AE, Crossey MM, Dawood M, Al-Mahtab M, Akbar SM, Rahman S, Riva A, Williams R, Taylor-Robinson SD. Urinary nuclear magnetic resonance spectroscopy of a Bangladeshi cohort with hepatitis-B hepatocellular carcinoma: A biomarker corroboration study. World J Gastroenterol 2016; 22(16): 4191-4200
- URL: https://www.wjgnet.com/1007-9327/full/v22/i16/4191.htm
- DOI: https://dx.doi.org/10.3748/wjg.v22.i16.4191


