Copyright
©The Author(s) 2016.
World J Gastroenterol. Apr 28, 2016; 22(16): 4168-4182
Published online Apr 28, 2016. doi: 10.3748/wjg.v22.i16.4168
Published online Apr 28, 2016. doi: 10.3748/wjg.v22.i16.4168
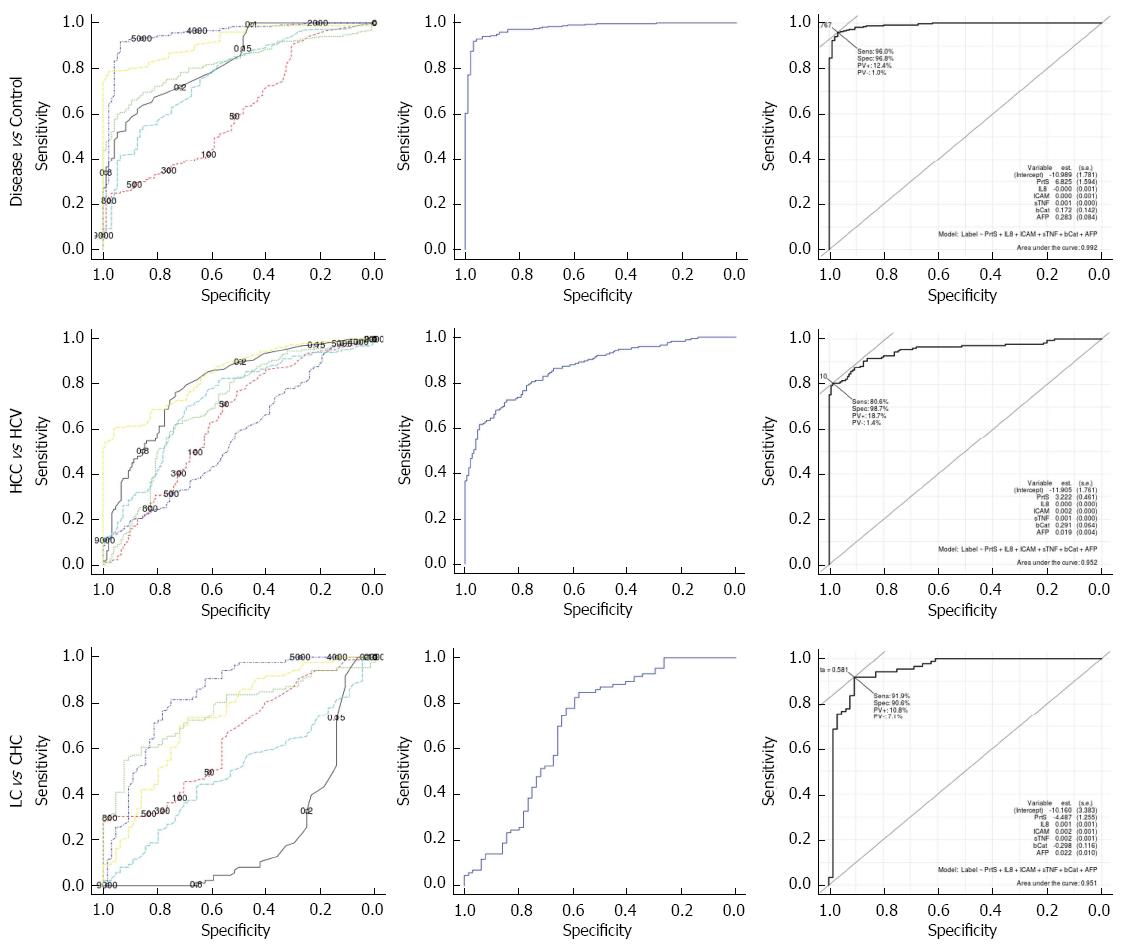
Figure 2 Receiver operating characteristic curves for the three pairwise comparisons of investigated groups used in our algorithm.
The leftmost column includes receiver operating characteristic (ROC) curves for individual markers, The middle columns includes ROC curves for Method 1 based on for the multi-class classifier, and the rightmost column includes ROC curves for Method2 based on binary class classifiers. On the ROC curve of Method 2, we depict the respective model and appropriate cut-offs. The different ROC curves for proteasome, IL-8, sICAM-1, sTNF-RII, β-catenin, and AFP in the leftmost column are colored black, red, green, blue, cyan, and yellow, respectively. Prts: Proteasome.
- Citation: Zekri ARN, Youssef ASED, Bakr YM, Gabr RM, Ahmed OS, Elberry MH, Mayla AM, Abouelhoda M, Bahnassy AA. Early detection of hepatocellular carcinoma co-occurring with hepatitis C virus infection: A mathematical model. World J Gastroenterol 2016; 22(16): 4168-4182
- URL: https://www.wjgnet.com/1007-9327/full/v22/i16/4168.htm
- DOI: https://dx.doi.org/10.3748/wjg.v22.i16.4168


