Copyright
©The Author(s) 2016.
World J Gastroenterol. Apr 28, 2016; 22(16): 4120-4135
Published online Apr 28, 2016. doi: 10.3748/wjg.v22.i16.4120
Published online Apr 28, 2016. doi: 10.3748/wjg.v22.i16.4120
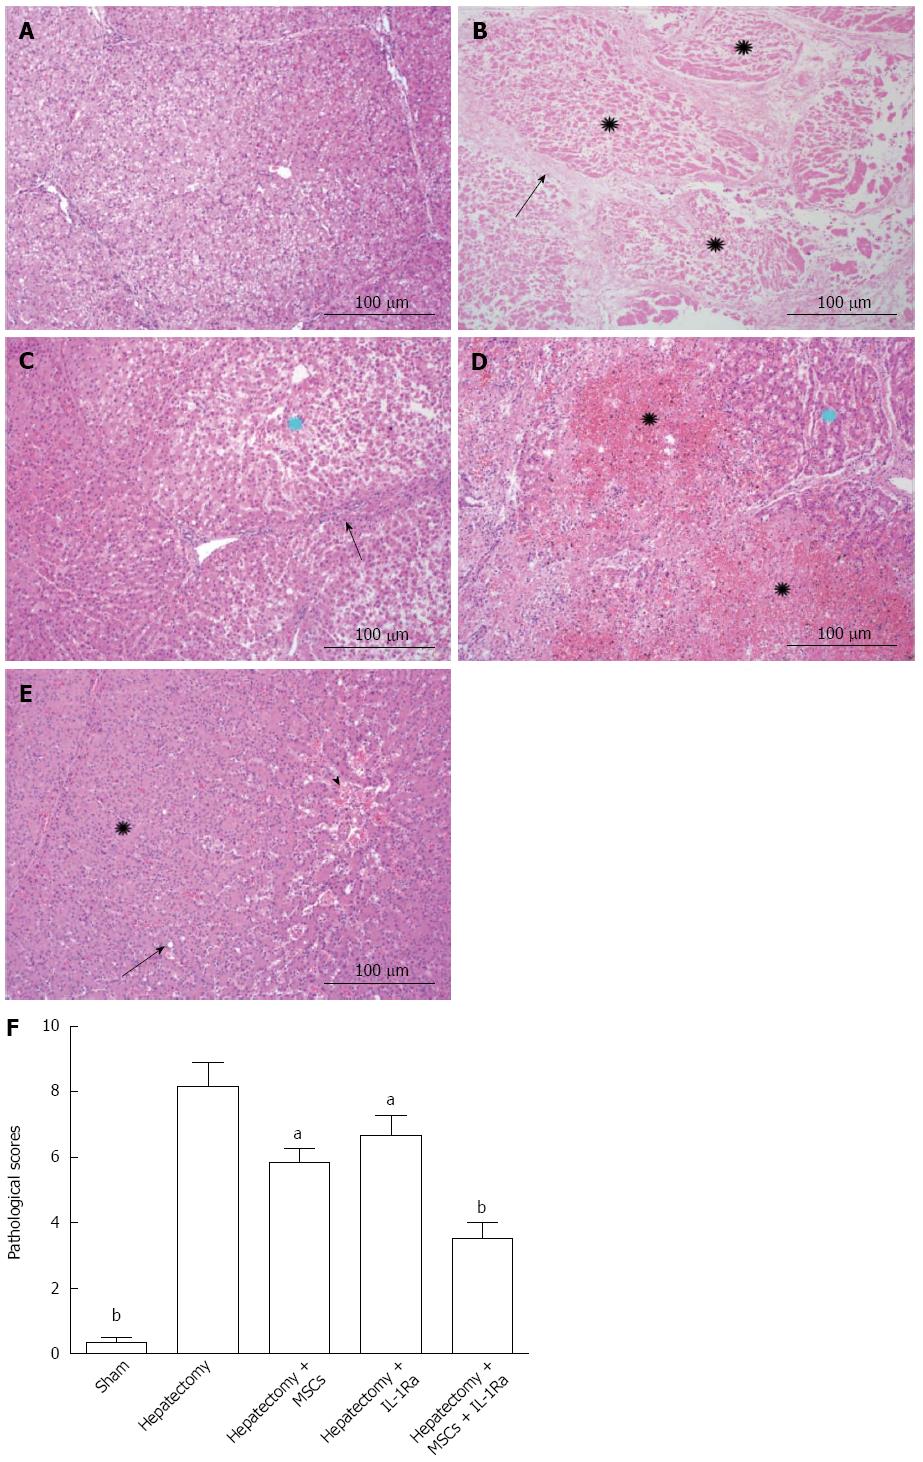
Figure 6 Histologic analysis of liver tissues.
Hematoxylin and eosin staining of liver sections taken seven days post-hepatectomy in A: Normal, sham-operated control; B: After hepatectomy (black stars indicate complete necrosis in liver organization; black arrow represents interlobular fiber structure); C: With MSC transplantation (blue star shows a hepatic lobule near the central part and necrosis of hepatocytes; black arrow shows the fibrous tissue and some inflammatory cell infiltration); D: Treatment with IL-1Ra (black stars show hemorrhage and necrosis in the hepatic lobe; blue star represents the liver cells in the hemorrhagic area); E: Combined MSC transplantation and IL-1Ra treatment (black star shows a normal hepatic lobule; black arrows indicate fatty degeneration of hepatocytes and hepatic sinus dilation with hyperemia in central hepatic lobe) (magnification × 100, scale bar = 100 μm); F: Histopathologic scores of liver tissues after hepatectomy. aP < 0.05 vs hepatectomy + MSCs + IL-1Ra; bP < 0.01 vs hepatectomy. IL-1Ra: Interleukin-1 receptor antagonist; MSC: Mesenchymal stem cell transplantation.
- Citation: Sang JF, Shi XL, Han B, Huang X, Huang T, Ren HZ, Ding YT. Combined mesenchymal stem cell transplantation and interleukin-1 receptor antagonism after partial hepatectomy. World J Gastroenterol 2016; 22(16): 4120-4135
- URL: https://www.wjgnet.com/1007-9327/full/v22/i16/4120.htm
- DOI: https://dx.doi.org/10.3748/wjg.v22.i16.4120


