Copyright
©The Author(s) 2016.
World J Gastroenterol. Apr 21, 2016; 22(15): 4062-4065
Published online Apr 21, 2016. doi: 10.3748/wjg.v22.i15.4062
Published online Apr 21, 2016. doi: 10.3748/wjg.v22.i15.4062
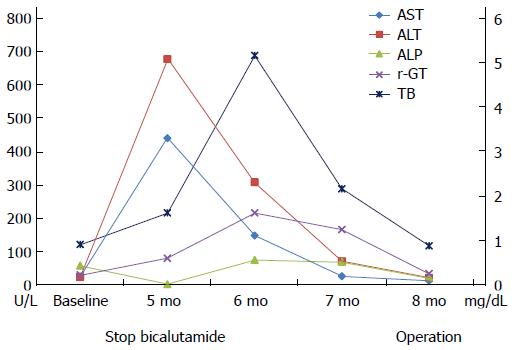
Figure 2 Courses of the laboratory findings from baseline (treatment initiation) to 8 mo later.
The right axis (0-6) shows the values of TB (mg/dL). The left axis shows the values for AST, ALT, ALP, and r-GT (U/L). ALP: Alkaline phosphatase; ALT: Alanine aminotransferase; AST: Aspartate aminotransferase; TB: Total bilirubin, r-GT: Gamma-glutamyl transpeptidase.
- Citation: Yun GY, Kim SH, Kim SW, Joo JS, Kim JS, Lee ES, Lee BS, Kang SH, Moon HS, Sung JK, Lee HY, Kim KH. Atypical onset of bicalutamide-induced liver injury. World J Gastroenterol 2016; 22(15): 4062-4065
- URL: https://www.wjgnet.com/1007-9327/full/v22/i15/4062.htm
- DOI: https://dx.doi.org/10.3748/wjg.v22.i15.4062


