Copyright
©The Author(s) 2016.
World J Gastroenterol. Apr 21, 2016; 22(15): 3952-3961
Published online Apr 21, 2016. doi: 10.3748/wjg.v22.i15.3952
Published online Apr 21, 2016. doi: 10.3748/wjg.v22.i15.3952
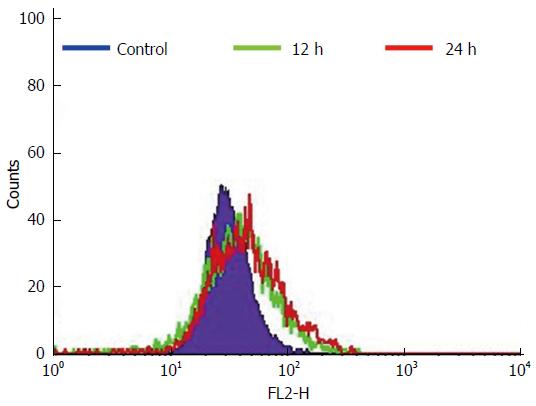
Figure 5 Lipid layer break provoked by gallic acid.
HCT-15 cells were treated with gallic acid (GA) and evaluated using merocyanine-540 to quantify the lipid layer breaks (LLBs). The fluorescence intensity was estimated using flow cytometry. Data is representative of three independent experiments, mean differences are significant at 12 h and 24 h compared with untreated control cells (P < 0.05 vs untreated control cells).
- Citation: Subramanian AP, Jaganathan SK, Mandal M, Supriyanto E, Muhamad II. Gallic acid induced apoptotic events in HCT-15 colon cancer cells. World J Gastroenterol 2016; 22(15): 3952-3961
- URL: https://www.wjgnet.com/1007-9327/full/v22/i15/3952.htm
- DOI: https://dx.doi.org/10.3748/wjg.v22.i15.3952


