Copyright
©The Author(s) 2016.
World J Gastroenterol. Apr 14, 2016; 22(14): 3746-3757
Published online Apr 14, 2016. doi: 10.3748/wjg.v22.i14.3746
Published online Apr 14, 2016. doi: 10.3748/wjg.v22.i14.3746
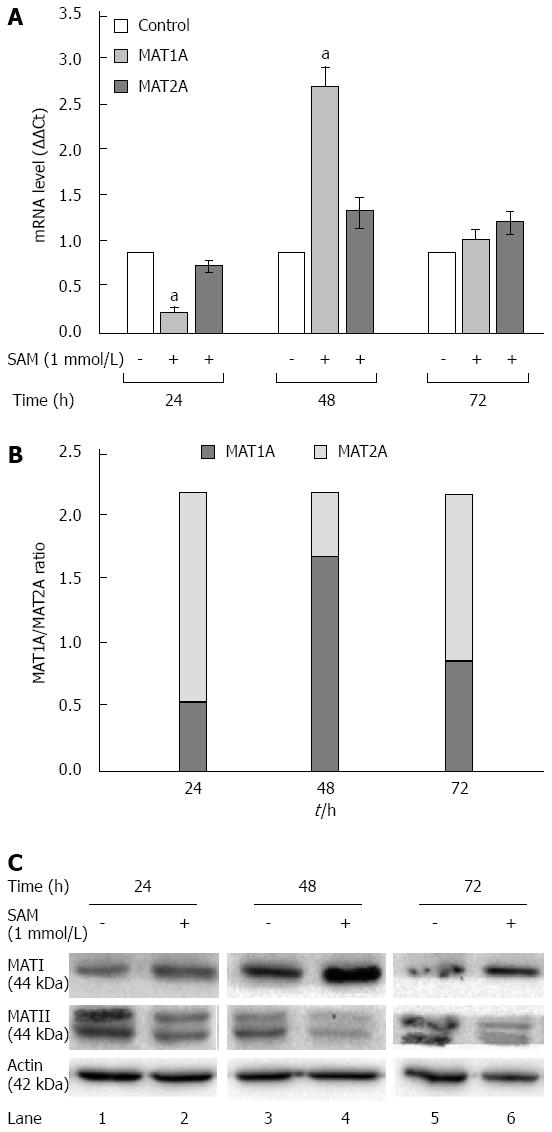
Figure 5 Effect of S-adenosyl-L-methionine on methionine adenosyltransferase 1/2 turnover.
A: Assesment of MAT-mRNA: Huh7 HCV replicon cells (2 × 10⁵ cells) were incubated with 1 mmol/L SAM and then cells were harvested at 24, 48 and 72 h and MAT1 and MAT2 mRNA levels were quantified by real-time RT-PCR and normalized with GAPDH and RPS18 using delta delta Ct method. Mean results from three independent experiments are shown. aP≤ 0.05 comparison of SAM vs untreated cells; B: MAT1A/MAT2A Turnover: Measured MAT1A/MAT2A expression represented as a total; C: MAT1 and MAT2 protein expression: Huh7 HCV replicon cells (2 × 10⁵ cells) were incubated with SAM 1 mmol/L. Cells were harvested at 24, 48 and 72 h and total proteins were obtained. Cell lysates were prepared, and equal amounts of protein extracts (40 μg) were subjected to immunoblot analysis to detect MAT1, MAT2 and actin levels. SAM: S-adenosyl-L-methionine; HCV: Hepatitis C virus; MAT: Methionine adenosyltransferase.
- Citation: Lozano-Sepulveda SA, Bautista-Osorio E, Merino-Mascorro JA, Varela-Rey M, Muñoz-Espinosa LE, Cordero-Perez P, Martinez-Chantar ML, Rivas-Estilla AM. S-adenosyl-L-methionine modifies antioxidant-enzymes, glutathione-biosynthesis and methionine adenosyltransferases-1/2 in hepatitis C virus-expressing cells. World J Gastroenterol 2016; 22(14): 3746-3757
- URL: https://www.wjgnet.com/1007-9327/full/v22/i14/3746.htm
- DOI: https://dx.doi.org/10.3748/wjg.v22.i14.3746


