Copyright
©The Author(s) 2016.
World J Gastroenterol. Apr 14, 2016; 22(14): 3746-3757
Published online Apr 14, 2016. doi: 10.3748/wjg.v22.i14.3746
Published online Apr 14, 2016. doi: 10.3748/wjg.v22.i14.3746
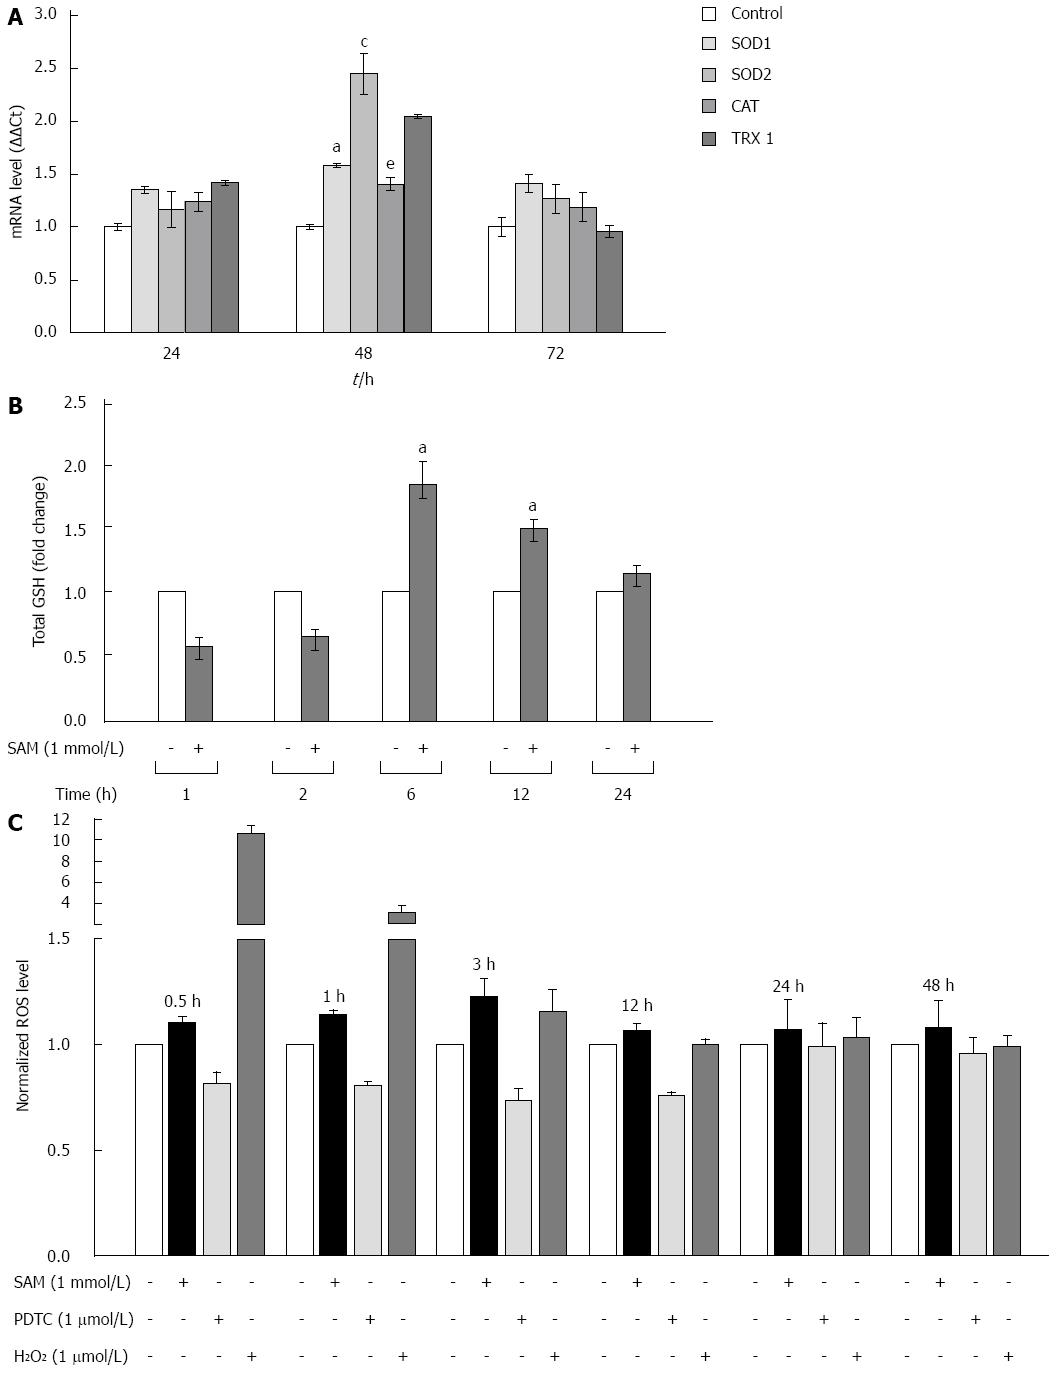
Figure 4 Effect of S-adenosyl-L-methionine exposition on oxidative stress markers.
A: Effect of SAM on antioxidant enzyme expression. Huh7 HCV replicon cells (2 × 10⁵ cells) were incubated with 1 mmol/L SAM and then cells were harvested at 24, 48 and 72 h. SOD1, SOD2, catalase and thioredoxin 1 mRNA levels were quantified by real-time RT-PCR and normalized with GAPDH and RPS18 using the delta delta Ct method. Mean results from three independent experiments are shown. aP≤ 0.05 comparison of SOD1 expression in cells treated with SAM vs untreated cells; cP≤ 0.05, SOD2 expression of SAM treated cells vs untreated; and eP≤ 0.05, TRX1 expression of SAM treated cells vs untreated; B: Total glutathione amount in HCV-replicon cells treated with SAM. Huh7 HCV-replicon cells (2 × 10⁵ cells) were treated with 1 mmol/L SAM. Total glutathione level was evaluated at different times by Ellman’s recycling method (0-24 h). Mean results from three independent experiments are shown; C: Effect of SAM in ROS levels. HCV replicon-containing cells (2 × 10⁴ cells) were incubated with 1 mmol/L SAM at different time points (0.5, 1, 3, 12, 24 and 48 h). ROS levels were assessed by DCFH-DA assay. Fluorescence was measured at 503 nm and 530 nm, excitation and emission wavelengths, respectively. Hydrogen peroxide (1 μmol/L H2O2) was used as a positive damage control and pyrrolidine dithiocarbamate (5 μmol/L PDTC) as antioxidant control. SAM: S-adenosyl-L-methionine; HCV: Hepatitis C virus; SOD: Superoxide dismutase; ROS: Reactive oxidative species; PDTC: Pyrrolidin dithiocarbamate.
- Citation: Lozano-Sepulveda SA, Bautista-Osorio E, Merino-Mascorro JA, Varela-Rey M, Muñoz-Espinosa LE, Cordero-Perez P, Martinez-Chantar ML, Rivas-Estilla AM. S-adenosyl-L-methionine modifies antioxidant-enzymes, glutathione-biosynthesis and methionine adenosyltransferases-1/2 in hepatitis C virus-expressing cells. World J Gastroenterol 2016; 22(14): 3746-3757
- URL: https://www.wjgnet.com/1007-9327/full/v22/i14/3746.htm
- DOI: https://dx.doi.org/10.3748/wjg.v22.i14.3746


