Copyright
©The Author(s) 2016.
World J Gastroenterol. Apr 14, 2016; 22(14): 3712-3724
Published online Apr 14, 2016. doi: 10.3748/wjg.v22.i14.3712
Published online Apr 14, 2016. doi: 10.3748/wjg.v22.i14.3712
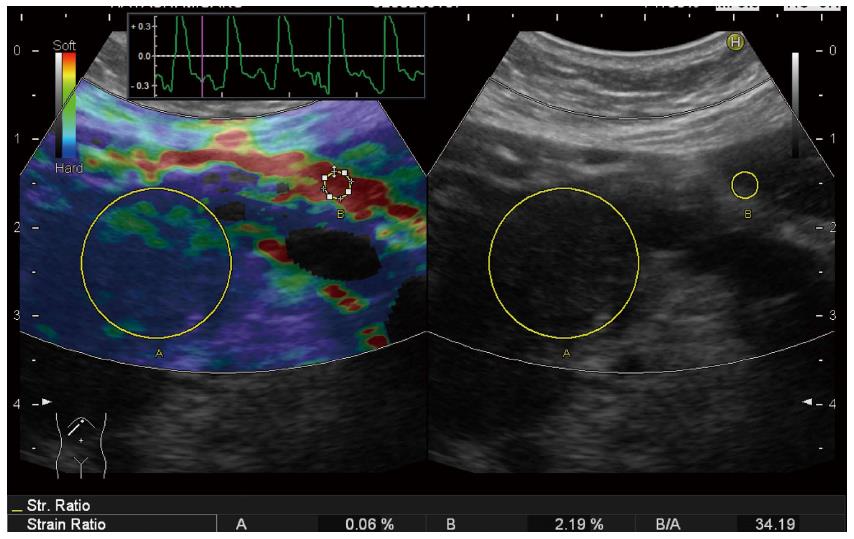
Figure 3 Quantitative diagnosis in US-Real-time Tissue ElastographyTM.
A hypoechoic tumor is seen at the pancreatic tail in B-mode (right). Region of interest (ROI) [A] is set on the tumor, and ROI [B] is set on read area around the pancreas (left). By setting ROI [A] and [B], strain [A], strain [B], and strain ration [B/A] were calculated automatically and displayed at the bottom of the screen (left).
- Citation: Kawada N, Tanaka S. Elastography for the pancreas: Current status and future perspective. World J Gastroenterol 2016; 22(14): 3712-3724
- URL: https://www.wjgnet.com/1007-9327/full/v22/i14/3712.htm
- DOI: https://dx.doi.org/10.3748/wjg.v22.i14.3712


