Copyright
©The Author(s) 2016.
World J Gastroenterol. Mar 21, 2016; 22(11): 3165-3174
Published online Mar 21, 2016. doi: 10.3748/wjg.v22.i11.3165
Published online Mar 21, 2016. doi: 10.3748/wjg.v22.i11.3165
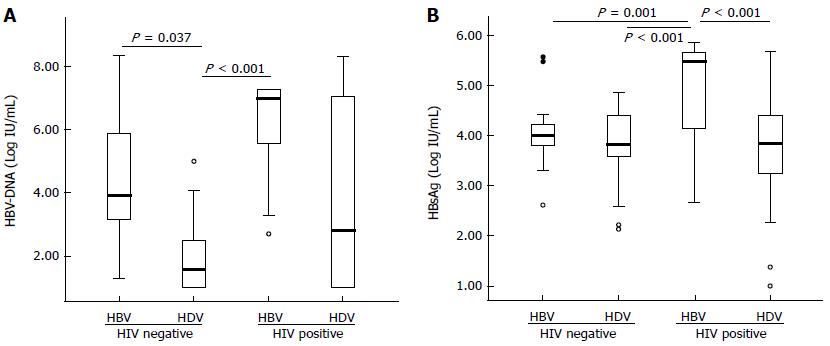
Figure 1 Box-plot analysis of the hepatitis B virus-DNA levels (A) and the hepatitis B surface antigen titers (B).
Data of HBV-DNA and HBsAg titers are expressed as Log10 (copies/mL) and Log10 (IU/mL), respectively. Both markers show a similar pattern except in the group of patients with CHD, which had low levels of HBV-DNA, but a relatively high level of HBsAg titers. Extreme values are represented as circles or asterisks. HBV: Hepatitis B virus; HDV: Hepatitis delta virus; HIV: Human immunodeficiency virus; CHD: Chronic hepatitis delta; HBsAg: Hepatitis B surface antigen.
- Citation: Madejón A, Romero M, Hernández &, García-Sánchez A, Sánchez-Carrillo M, Olveira A, García-Samaniego J. Hepatitis B and D viruses replication interference: Influence of hepatitis B genotype. World J Gastroenterol 2016; 22(11): 3165-3174
- URL: https://www.wjgnet.com/1007-9327/full/v22/i11/3165.htm
- DOI: https://dx.doi.org/10.3748/wjg.v22.i11.3165


