Copyright
©The Author(s) 2016.
World J Gastroenterol. Mar 14, 2016; 22(10): 2981-2992
Published online Mar 14, 2016. doi: 10.3748/wjg.v22.i10.2981
Published online Mar 14, 2016. doi: 10.3748/wjg.v22.i10.2981
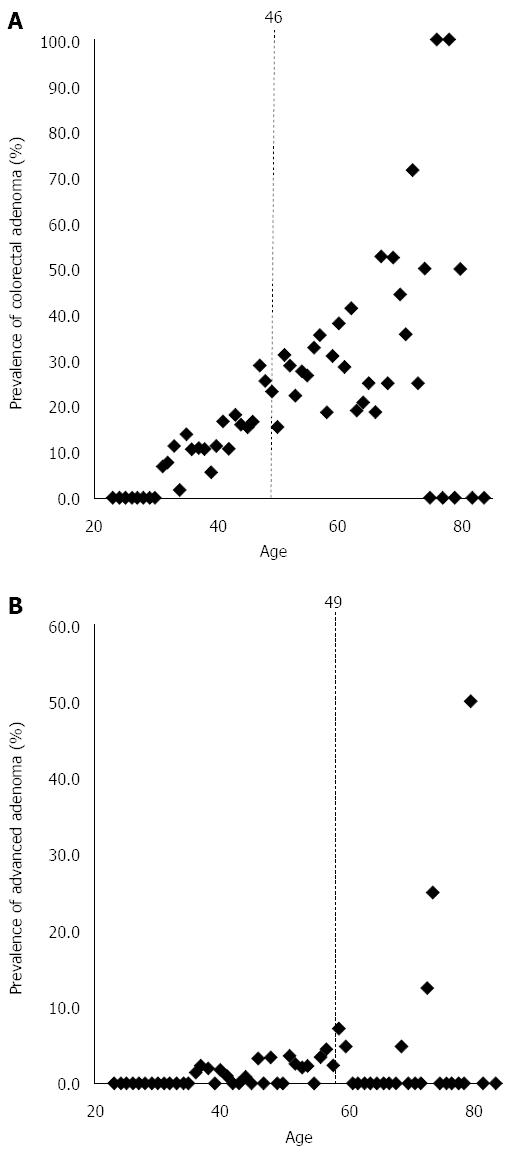
Figure 2 Hierachial cluster analysis.
Scatter plot shows relationships among the age and incidence of adenoma. A and B indicates the age and incidence of colorectal adenoma and advanced adenoma, respectively. Red broken lines indicate demarcations from cluster analysis.
- Citation: Lee SE, Jo HB, Kwack WG, Jeong YJ, Yoon YJ, Kang HW. Characteristics of and risk factors for colorectal neoplasms in young adults in a screening population. World J Gastroenterol 2016; 22(10): 2981-2992
- URL: https://www.wjgnet.com/1007-9327/full/v22/i10/2981.htm
- DOI: https://dx.doi.org/10.3748/wjg.v22.i10.2981


