Copyright
©The Author(s) 2016.
World J Gastroenterol. Mar 14, 2016; 22(10): 2931-2948
Published online Mar 14, 2016. doi: 10.3748/wjg.v22.i10.2931
Published online Mar 14, 2016. doi: 10.3748/wjg.v22.i10.2931
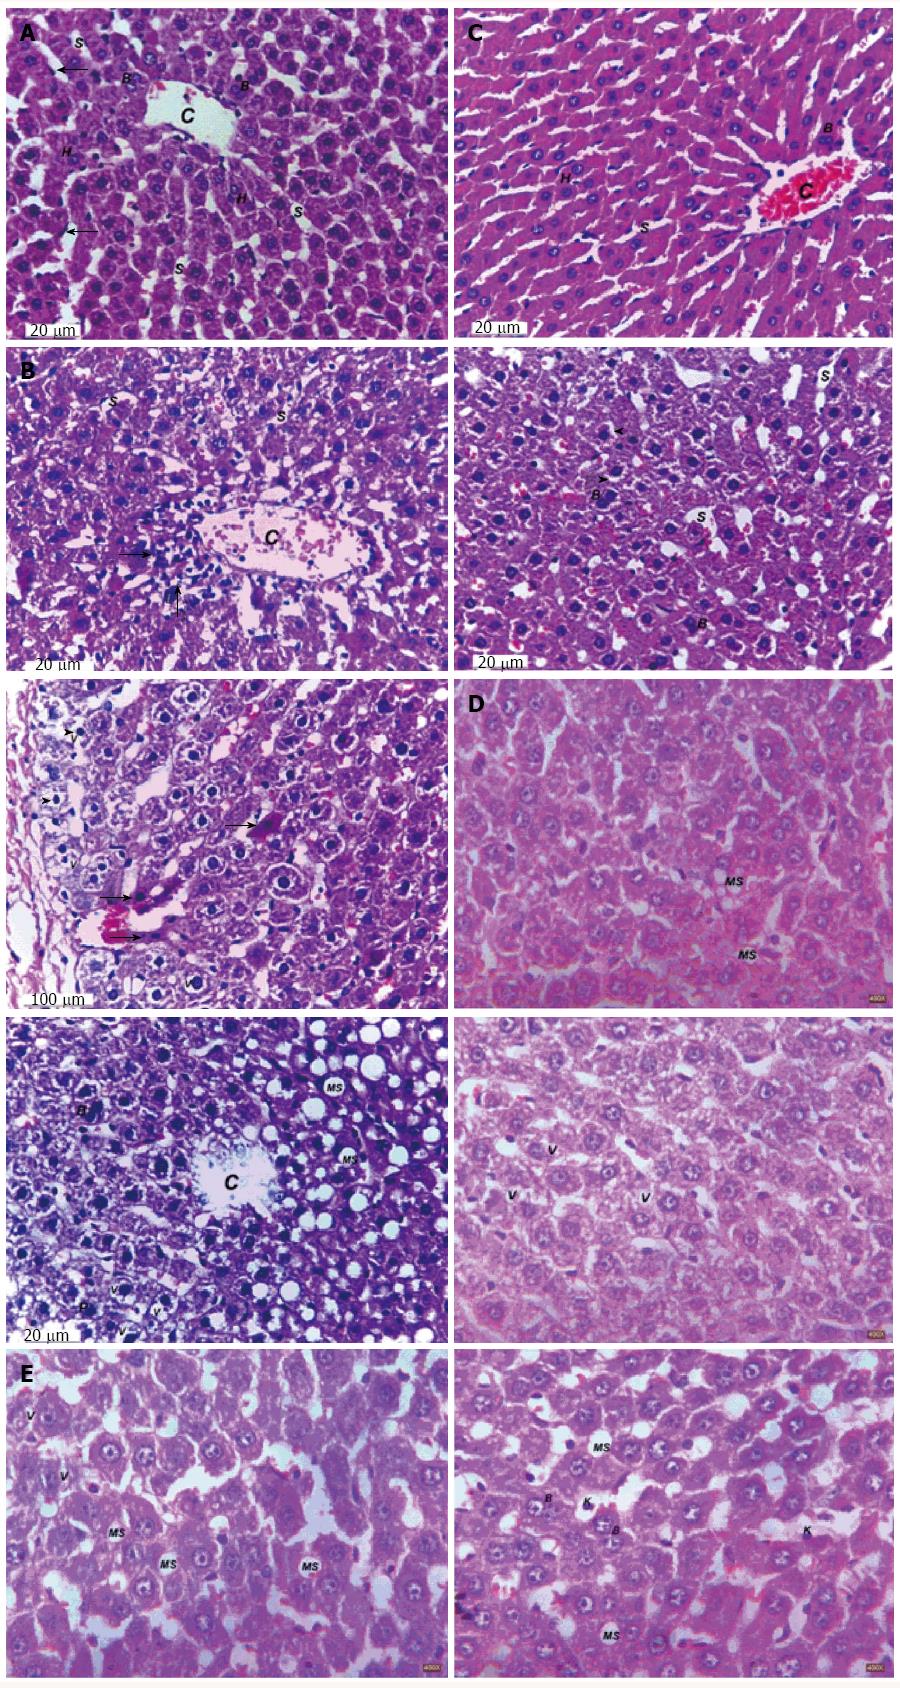
Figure 8 Representative photomicrographs of liver sections of control (A), FED (Bs), fenofibrate (100 mg/kg) (Cs), resveratrol (70 mg/kg) (Ds) and fenofibrate + resveratrol (half doses) (E) in fructose-induced NASH in rats.
A: Control rat liver showing a central vein (C), hepatocytes (H) arranged in the form of plates separated from each other by irregular blood sinusoids (S). B1: Fructose-fed rat liver showing cellular infiltration (arrows) near the central vein (C); B2: Fructose-fed rat liver showing pyknotic hepatic nuclei (arrowheads), cytoplasmic vacuolations (V) and apoptotic hepatic cells (arrows); B3: Fructose-fed rat liver showing central vein (C) with macrovesicular steatosis (MS) compressing hepatic nuclei to the right side of the vein, and cytoplasmic vacuolations (V), pyknotic nuclei (P) and binucleated hepatic cells to the left side of the vein; C1: Fenofibrate-treated rat liver showing nearly normal liver. A central vein (C), hepatocytes (H) arranged in the form of plates separated from each other by irregular blood sinusoids (S); C2: Fenofibrate-treated rat liver showing cytoplasmic vacuolations (arrowheads) of hepatic cells; D1: Resveratrol-treated rat liver showing macrovesicular steatosis (MS); D2: Resveratrol-treated rat liver showing vacuolations (V) of the cytoplasm of the hepatic cells; E1: Fenofibrate + Resveratrol-treated rat liver showing macrovesicular steatosis (MS) not compressing hepatic nuclei; E2: Fenofibrate + Resveratrol-treated rat liver showing macrovesicular steatosis (MS) and vacuolations (V) within the cytoplasm of the hepatic cells (HE × 400).
- Citation: Abd El-Haleim EA, Bahgat AK, Saleh S. Resveratrol and fenofibrate ameliorate fructose-induced nonalcoholic steatohepatitis by modulation of genes expression. World J Gastroenterol 2016; 22(10): 2931-2948
- URL: https://www.wjgnet.com/1007-9327/full/v22/i10/2931.htm
- DOI: https://dx.doi.org/10.3748/wjg.v22.i10.2931


