Copyright
©The Author(s) 2016.
World J Gastroenterol. Jan 7, 2016; 22(1): 89-102
Published online Jan 7, 2016. doi: 10.3748/wjg.v22.i1.89
Published online Jan 7, 2016. doi: 10.3748/wjg.v22.i1.89
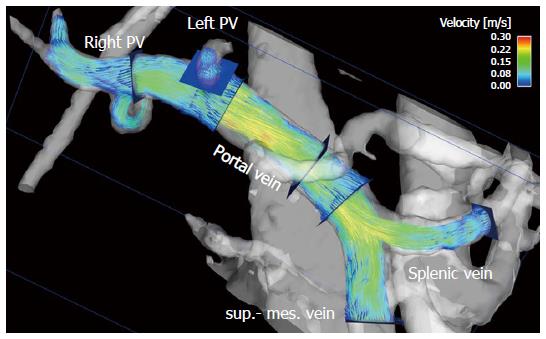
Figure 1 Particle traces visualization of portal venous flow in a healthy volunteer.
Blue emitter planes were positioned in the splenic vein and superior mesenteric vein (sup.-mes. vein), portal vein, right (right PV) and left (left PV) intrahepatic portal vein branch. The gray-shaded iso-surface three-dimensional angiogram has been calculated from the 4D flow magnetic resonance imaging data. Color-coded peak velocities in the inflow of the portal vein from the splenic and superior mesenteric veins and the intrahepatic part of the portal vein.
- Citation: Stankovic Z. Four-dimensional flow magnetic resonance imaging in cirrhosis. World J Gastroenterol 2016; 22(1): 89-102
- URL: https://www.wjgnet.com/1007-9327/full/v22/i1/89.htm
- DOI: https://dx.doi.org/10.3748/wjg.v22.i1.89


