Copyright
©The Author(s) 2016.
World J Gastroenterol. Jan 7, 2016; 22(1): 379-393
Published online Jan 7, 2016. doi: 10.3748/wjg.v22.i1.379
Published online Jan 7, 2016. doi: 10.3748/wjg.v22.i1.379
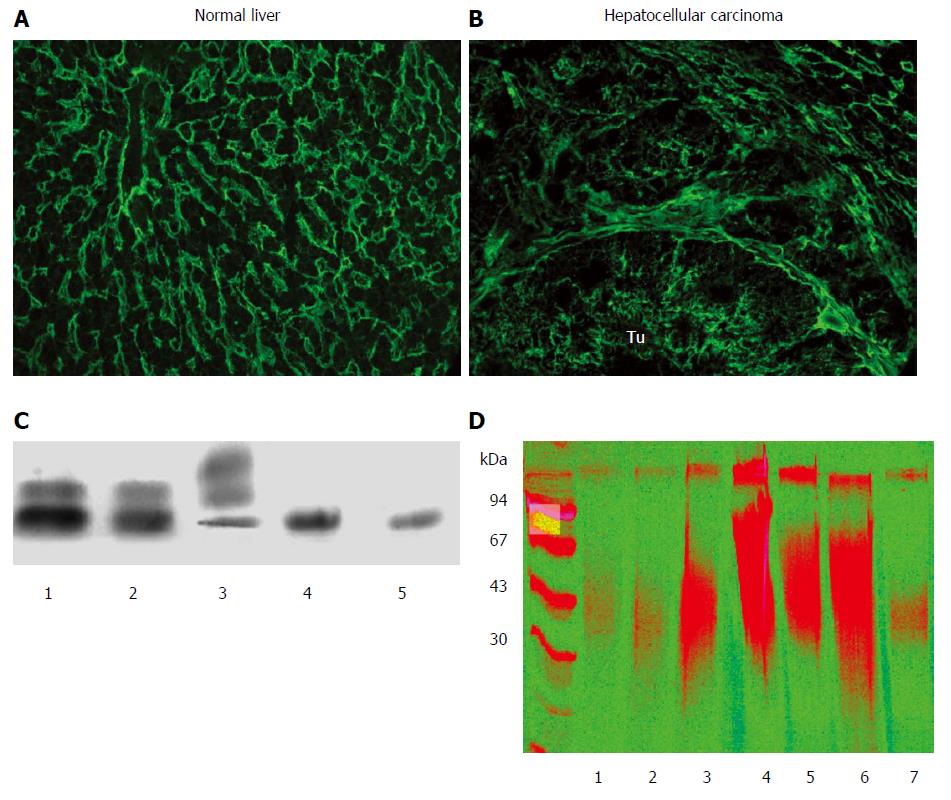
Figure 1 Expression of proteoglycans in normal and diseased liver.
Detection of heparan sulfate (HS4C3 antibody) in normal liver (A) and in liver cancer (B). In normal liver the reaction is localized mainly in the sinusoids, and delicate staining is visible on the surface of hepatocytes. In contrast, in hepatocellular carcinoma (HCC) amplified amounts of heparan sulfate (HS) are visible around the individual tumor cells, most likely representing the sugar component of cell surface HSPGs. Connective tissue surrounding the tumorous nests is also loaded with HS; C: Typical picture of glycosaminoglycan (GAG) on cellulose acetate electrophoresis. GAG isolated from normal liver (1), from peritumoral liver (2), from liver cancer (3), from normal liver after chondroitinase ABC digestion (4, 5). Bands from the bottom to the top: heparan sulfate, dermatan sulfate, chondroitin sulfate. Note that the majority of GAGs are HS in the normal and peritumoral liver, whereas CS dominates in HCC; D: Separation of proteoglycans of liver origin on PAGE. Liver surrounding colon cancer metastasis (1), healthy liver (2), liver from α1-antitrypsin deficiency (3), fibrolamellar carcinoma (4), peritumoral liver of FLC (5), HCC (6), and peritumoral liver of HCC (7). Artificial colorization emphasizes the difference between normal and diseased specimens.
- Citation: Baghy K, Tátrai P, Regős E, Kovalszky I. Proteoglycans in liver cancer. World J Gastroenterol 2016; 22(1): 379-393
- URL: https://www.wjgnet.com/1007-9327/full/v22/i1/379.htm
- DOI: https://dx.doi.org/10.3748/wjg.v22.i1.379


