Copyright
©The Author(s) 2016.
World J Gastroenterol. Jan 7, 2016; 22(1): 205-220
Published online Jan 7, 2016. doi: 10.3748/wjg.v22.i1.205
Published online Jan 7, 2016. doi: 10.3748/wjg.v22.i1.205
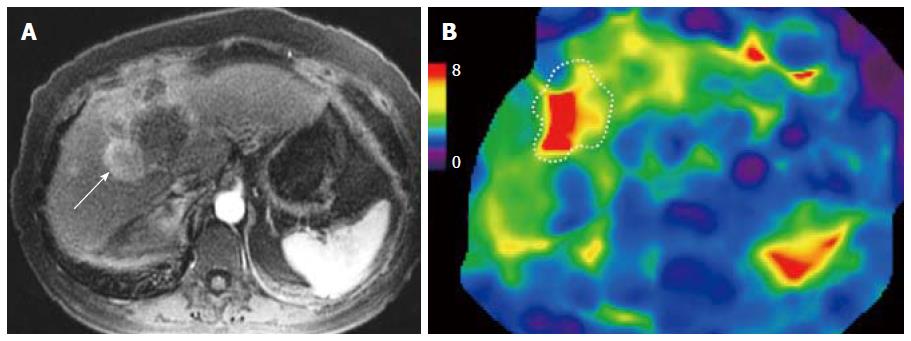
Figure 15 Magnetic resonance elastography of hepatocellular carcinoma.
Arterial phase image (A) and stiffness map (B) from magnetic resonance elastography. The color scale of the stiffness map is expressed in kilopascal (kPa). A case of chronic alcoholic liver disease with liver stiffness of 5.3 kPa consistent with cirrhosis. The enhancing hepatocellular carcinoma (white arrow) has mean stiffness of 8.2 kPa suspicious for a malignant tumour. Note the tumor is stiffer in the more hyper enhancing regions of the tumour.
- Citation: Hennedige T, Venkatesh SK. Advances in computed tomography and magnetic resonance imaging of hepatocellular carcinoma. World J Gastroenterol 2016; 22(1): 205-220
- URL: https://www.wjgnet.com/1007-9327/full/v22/i1/205.htm
- DOI: https://dx.doi.org/10.3748/wjg.v22.i1.205


