Copyright
©The Author(s) 2015.
World J Gastroenterol. Mar 7, 2015; 21(9): 2759-2769
Published online Mar 7, 2015. doi: 10.3748/wjg.v21.i9.2759
Published online Mar 7, 2015. doi: 10.3748/wjg.v21.i9.2759
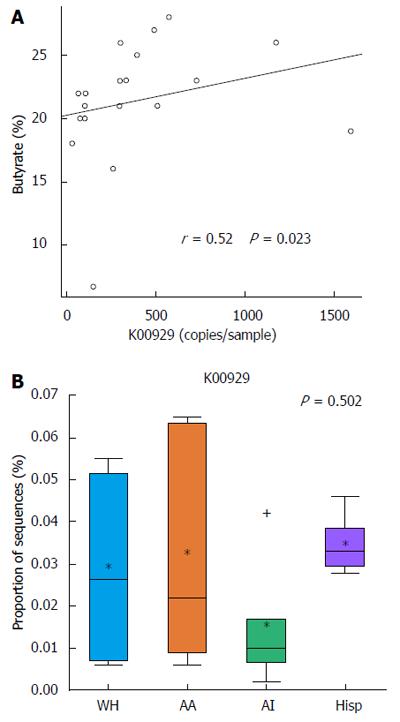
Figure 4 PICRUSt analysis of 16S rRNA and correlating with experimental butyrate levels.
A: Spearman Correlation analysis suggest moderately strong correlation (r = 0.52) prediction of K00929 pathway (butanoate pathway) vs experimental butyrate levels with significant P value (P = 0.023); B: Box plot indicating relative abundance of KO K00929 across ethnic groups (* = mean; + = points beyond 25th-75th percentile).
- Citation: Hester CM, Jala VR, Langille MG, Umar S, Greiner KA, Haribabu B. Fecal microbes, short chain fatty acids, and colorectal cancer across racial/ethnic groups. World J Gastroenterol 2015; 21(9): 2759-2769
- URL: https://www.wjgnet.com/1007-9327/full/v21/i9/2759.htm
- DOI: https://dx.doi.org/10.3748/wjg.v21.i9.2759


