Copyright
©The Author(s) 2015.
World J Gastroenterol. Feb 28, 2015; 21(8): 2573-2576
Published online Feb 28, 2015. doi: 10.3748/wjg.v21.i8.2573
Published online Feb 28, 2015. doi: 10.3748/wjg.v21.i8.2573
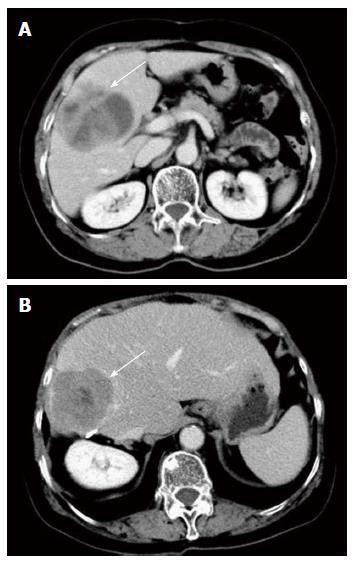
Figure 1 Computed tomography images of the tumor.
A: An enhanced abdominal computed tomography (CT) scan from August 2009 showed a 7.4 cm × 6.2 cm solid-cystic mass in the right hepatic lobe (venous phases in the axial plane). The central portion was of low-density with thickened irregular peripheral margins; B: An enhanced abdominal CT scan in September 2011 showed a 6 cm × 5 cm solid-cystic mass in the residual right liver (venous phases in the axial plane).
- Citation: Lin XK, Zhang Q, Yang WL, Shou CH, Liu XS, Sun JY, Yu JR. Primary gastrointestinal stromal tumor of the liver treated with sequential therapy. World J Gastroenterol 2015; 21(8): 2573-2576
- URL: https://www.wjgnet.com/1007-9327/full/v21/i8/2573.htm
- DOI: https://dx.doi.org/10.3748/wjg.v21.i8.2573


