Copyright
©The Author(s) 2015.
World J Gastroenterol. Feb 21, 2015; 21(7): 2011-2029
Published online Feb 21, 2015. doi: 10.3748/wjg.v21.i7.2011
Published online Feb 21, 2015. doi: 10.3748/wjg.v21.i7.2011
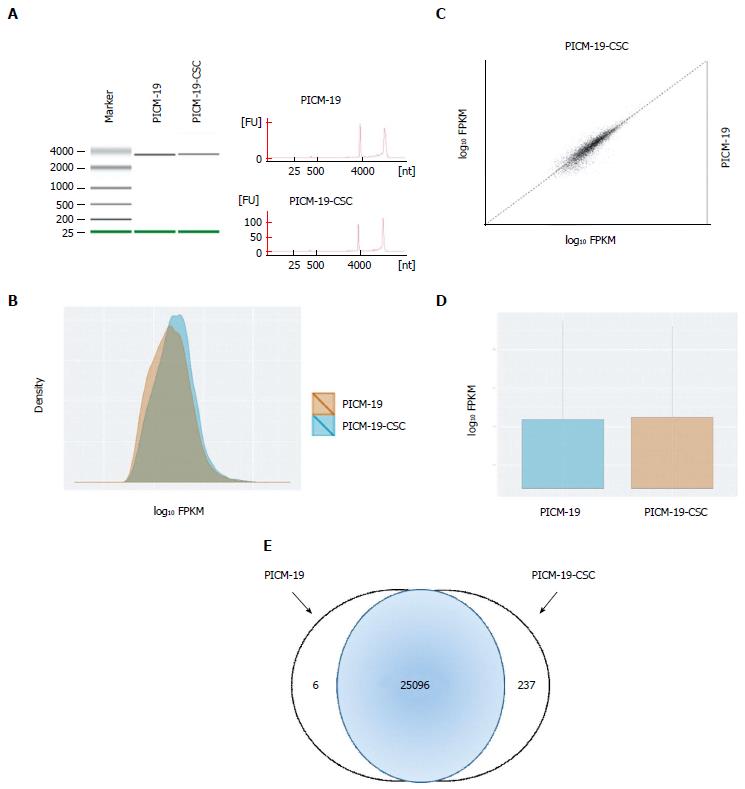
Figure 3 RNA sequencing of PICM-19 liver stem cells and PICM-19-CSCs.
A: Quality of the RNA extracted from PICM-19 and PICM-19-CSCs was assessed by electrophoresis (left panel) and by Nanodrop measurement to determine (RIN) for each cell type. RIN for PICM-19 and PICM-19-CSCs was 9.50 and 9.30, respectively. After the completion of sequencing, data was analyzed with TopHat and Cufflinks (see Materials and Methods), differential gene expression was calculated as fragments per kilobase of transcripts per million mapped reads (FPKM). Data thus obtained was plotted as a B: Density plot; C: Scatter Matrix plot; D: Box plot. Differentially expressed genes for each cell type were shown as log10 fold change. log10 fold change of 2 or greater was considered significant. In total, 25096 genes were differentially expressed in both cell types, whereas PICM-19 and PICM-19-CSCs displayed unique expression of 6 and 237 genes, respectively.
- Citation: Aravalli RN, Talbot NC, Steer CJ. Gene expression profiling of MYC-driven tumor signatures in porcine liver stem cells by transcriptome sequencing. World J Gastroenterol 2015; 21(7): 2011-2029
- URL: https://www.wjgnet.com/1007-9327/full/v21/i7/2011.htm
- DOI: https://dx.doi.org/10.3748/wjg.v21.i7.2011


