Copyright
©The Author(s) 2015.
World J Gastroenterol. Feb 14, 2015; 21(6): 1989-1993
Published online Feb 14, 2015. doi: 10.3748/wjg.v21.i6.1989
Published online Feb 14, 2015. doi: 10.3748/wjg.v21.i6.1989
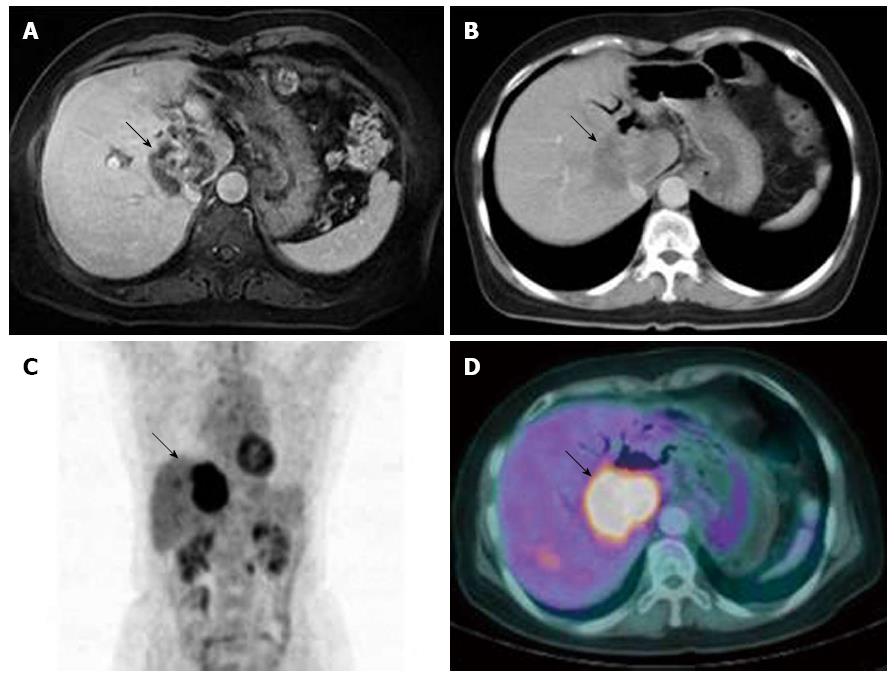
Figure 1 Computed tomography, magnetic resonance cholangiopancreatography, and positron-emission tomography-computed tomography showing an intrahepatic cholangiocalcinoma in the liver at first diagnosis.
A: Computed tomography axial scan shows an ill-defined, low-attenuation mass in segments S1 and S5 of the liver; B: Contrast-enhanced, T1-weighted, axial image shows the 6-cm, peripherally enhanced mass in segments S1, S5, and S8; C and D: In the positron-emission tomography-computed tomography images, an area of strong hypermetabolism is noted (arrows), corresponding to the 6-cm soft tissue mass in the liver (maximum standardized uptake value, 10.4).
- Citation: Lee J, Lee SW, Han SY, Baek YH, Kim SY, Rhyou HI. Rapidly aggravated skeletal muscle metastases from an intrahepatic cholangiocarcinoma. World J Gastroenterol 2015; 21(6): 1989-1993
- URL: https://www.wjgnet.com/1007-9327/full/v21/i6/1989.htm
- DOI: https://dx.doi.org/10.3748/wjg.v21.i6.1989


