Copyright
©The Author(s) 2015.
World J Gastroenterol. Feb 14, 2015; 21(6): 1915-1926
Published online Feb 14, 2015. doi: 10.3748/wjg.v21.i6.1915
Published online Feb 14, 2015. doi: 10.3748/wjg.v21.i6.1915
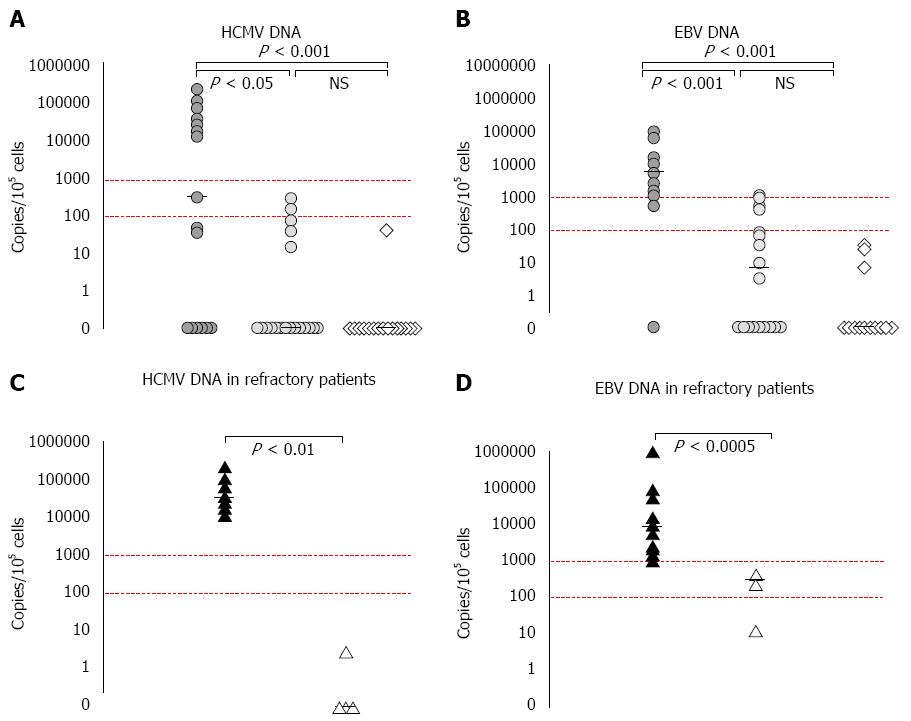
Figure 1 Refractory inflammatory bowel disease patients (full circles) showed statistically significant higher values in comparison with non-refractory patients (empty circles) and controls (empty rhombuses; panels A and B).
A peculiar distribution is observed with non-refractory patients displaying values always below 103 and controls below 102 copies/105 cells (red dotted lines). Within the refractory group, the macroscopically diseased areas (full triangles) carried DNA viral loads invariably over 103 copies/105 cells compared to non-diseased mucosa (empty triangles; panels C and D). The black bars indicate the median values. NS: Not significant; HCMV: Human Cytomegalovirus; EBV: Epstein-Barr virus.
- Citation: Ciccocioppo R, Racca F, Paolucci S, Campanini G, Pozzi L, Betti E, Riboni R, Vanoli A, Baldanti F, Corazza GR. Human cytomegalovirus and Epstein-Barr virus infection in inflammatory bowel disease: Need for mucosal viral load measurement. World J Gastroenterol 2015; 21(6): 1915-1926
- URL: https://www.wjgnet.com/1007-9327/full/v21/i6/1915.htm
- DOI: https://dx.doi.org/10.3748/wjg.v21.i6.1915


