Copyright
©The Author(s) 2015.
World J Gastroenterol. Feb 14, 2015; 21(6): 1775-1783
Published online Feb 14, 2015. doi: 10.3748/wjg.v21.i6.1775
Published online Feb 14, 2015. doi: 10.3748/wjg.v21.i6.1775
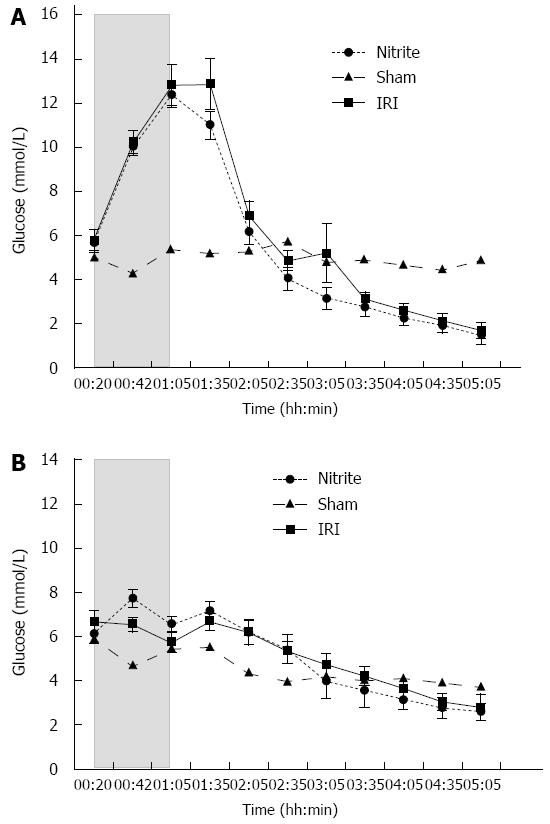
Figure 3 Parenchymal (microdialytic) glucose.
A: Parenchymal (microdialytic) glucose (mean ± SE) in the ischemic liver lobes in rats subjected to 45 min of segmental (left lateral lobe) liver ischemia and 4 h of reperfusion with (nitrite, n = 14) or without (ischemia reperfusion injury, IRI, n = 14) intravenous pre-treatment with 480 nmol of nitrite and sham operated animals (n = 8). During ischemia, parenchymal glucose increased in both groups without any difference noted between the groups. In the reperfusion phase, there was a steady decline in the glucose levels. The shaded area represents the ischemic phase; B: Parenchymal (microdialytic) glucose (mean ± SE) in the control (non-ischemic, right) liver lobes in rats subjected to 45 min of segmental (left lateral lobe) liver ischemia and 4 h of reperfusion with (nitrite, n = 14) or without (IRI, n = 14) intravenous pre-treatment with 480 nmol of nitrite and sham operated animals (n = 8). After the administration of nitrite, parenchymal glucose increased significantly (P < 0.001) and reached levels higher than those in the untreated group (P = 0.02).
- Citation: Björnsson B, Bojmar L, Olsson H, Sundqvist T, Sandström P. Nitrite, a novel method to decrease ischemia/reperfusion injury in the rat liver. World J Gastroenterol 2015; 21(6): 1775-1783
- URL: https://www.wjgnet.com/1007-9327/full/v21/i6/1775.htm
- DOI: https://dx.doi.org/10.3748/wjg.v21.i6.1775


