Copyright
©The Author(s) 2015.
World J Gastroenterol. Feb 7, 2015; 21(5): 1650-1662
Published online Feb 7, 2015. doi: 10.3748/wjg.v21.i5.1650
Published online Feb 7, 2015. doi: 10.3748/wjg.v21.i5.1650
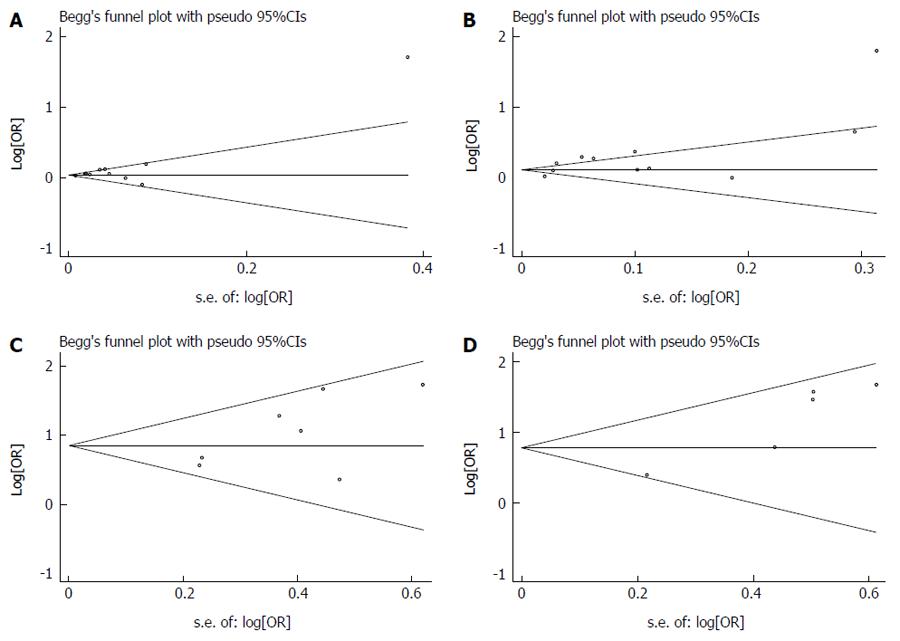
Figure 3 Funnel plots for publication bias.
A: Per-unit increase in waist circumference (WC) (P = 0.436); B: High vs low category of WC (P = 0.230); C: Per-unit increase in body mass index (BMI) (P = 0.533); D: High vs low category of BMI (P = 0.086). s.e.: Standard error.
- Citation: Pang Q, Zhang JY, Song SD, Qu K, Xu XS, Liu SS, Liu C. Central obesity and nonalcoholic fatty liver disease risk after adjusting for body mass index. World J Gastroenterol 2015; 21(5): 1650-1662
- URL: https://www.wjgnet.com/1007-9327/full/v21/i5/1650.htm
- DOI: https://dx.doi.org/10.3748/wjg.v21.i5.1650


