Copyright
©The Author(s) 2015.
World J Gastroenterol. Feb 7, 2015; 21(5): 1518-1530
Published online Feb 7, 2015. doi: 10.3748/wjg.v21.i5.1518
Published online Feb 7, 2015. doi: 10.3748/wjg.v21.i5.1518
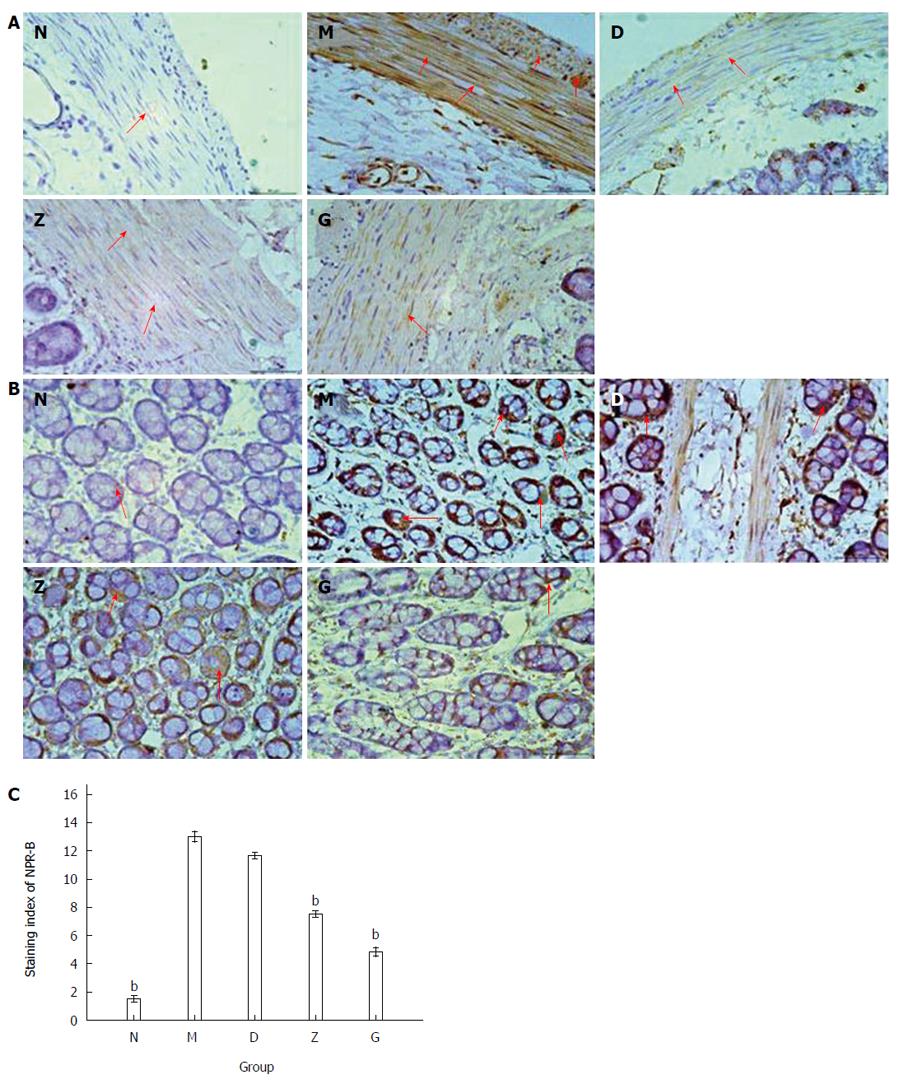
Figure 6 Immunohistochemical analysis of natriuretic peptide receptor B in rat rectum.
A: Natriuretic peptide receptor B (NPR-B) expression in rectum smooth muscle layer of rats; B: NPR-B expression in rectum mucosal/serosal layers of rats; C: Staining index of NPR-B expression in rat rectum of the five groups. Data are presented as mean ± SE. Arrows denote areas of positivity. N: Primary control group; M: Depression model group; D; Low dose Xiaoyaosan (XYS) group; Z: Middle dose XYS group; G: High dose XYS group. The difference between the depression model group and the primary control group was significant (n = 9; bP < 0.01 vs M). The high and middle XYS dose groups were significantly different compared with the depression model group (n = 9; bP < 0.01 vs M). Scale bar = 50 μm.
- Citation: Li P, Tang XD, Cai ZX, Qiu JJ, Lin XL, Zhu T, Owusu L, Guo HS. CNP signal pathway up-regulated in rectum of depressed rats and the interventional effect of Xiaoyaosan. World J Gastroenterol 2015; 21(5): 1518-1530
- URL: https://www.wjgnet.com/1007-9327/full/v21/i5/1518.htm
- DOI: https://dx.doi.org/10.3748/wjg.v21.i5.1518


