Copyright
©The Author(s) 2015.
World J Gastroenterol. Dec 28, 2015; 21(48): 13555-13565
Published online Dec 28, 2015. doi: 10.3748/wjg.v21.i48.13555
Published online Dec 28, 2015. doi: 10.3748/wjg.v21.i48.13555
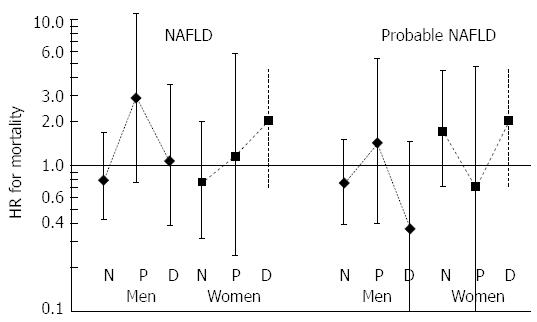
Figure 2 Diagram of multivariable adjusted hazard ratios are depicted for death of fatty liver disease in the 3 glucose categories.
Though significant findings were not obtained, the risk of overall mortality among normoglycemic (N) individuals with fatty liver disease was lower than in subjects with no fatty liver disease. Risk increased in prediabetes (P) and tended so in diabetic (D) women, while declining in men with diabetes. NAFLD: Non-alcoholic fatty liver disease.
- Citation: Onat A, Can G, Kaya A, Akbaş T, Özpamuk-Karadeniz F, Şimşek B, Çakır H, Yüksel H. Fatty liver disease: Disparate predictive ability for cardiometabolic risk and all-cause mortality. World J Gastroenterol 2015; 21(48): 13555-13565
- URL: https://www.wjgnet.com/1007-9327/full/v21/i48/13555.htm
- DOI: https://dx.doi.org/10.3748/wjg.v21.i48.13555


