Copyright
©The Author(s) 2015.
World J Gastroenterol. Dec 28, 2015; 21(48): 13466-13472
Published online Dec 28, 2015. doi: 10.3748/wjg.v21.i48.13466
Published online Dec 28, 2015. doi: 10.3748/wjg.v21.i48.13466
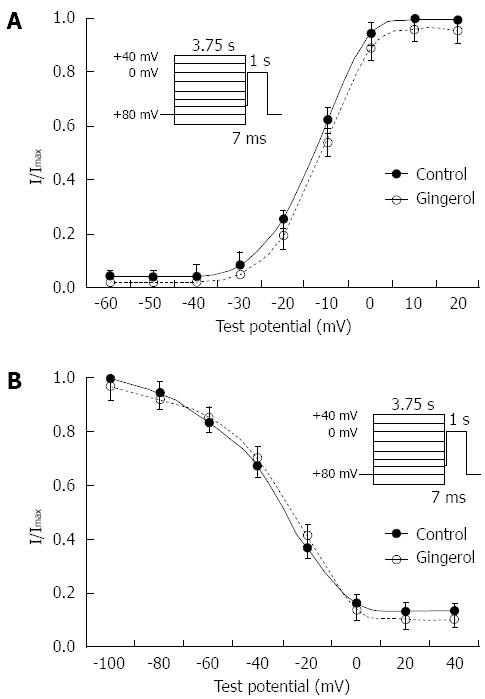
Figure 5 Steady state activation and the steady state inactivation curves.
A: Steady state activation for the cells exposed to 6-gingerol, peak conductance was determined from the peak inward currents, corrected for the change in driving force at each of the test potentials and normalized to 1. Driving force was obtained from the difference between the test potential and the observed reversal potential; B: Steady state inactivation relationship. Peak currents were obtained using a two-pulse protocol (3.75 s of prepulse potential from -100 to +40 mV) followed by a 7-ms interpulse interval at -60 mV, and the membrane potential was raised to a test potential of 0 mV for 1 s. The difference between peak current and late current present before and at the end of the test pulse was normalized to 1 and plotted against the prepulse potential.
- Citation: Cai ZX, Tang XD, Wang FY, Duan ZJ, Li YC, Qiu JJ, Guo HS. Effect of gingerol on colonic motility via inhibition of calcium channel currents in rats. World J Gastroenterol 2015; 21(48): 13466-13472
- URL: https://www.wjgnet.com/1007-9327/full/v21/i48/13466.htm
- DOI: https://dx.doi.org/10.3748/wjg.v21.i48.13466


