Copyright
©The Author(s) 2015.
World J Gastroenterol. Dec 28, 2015; 21(48): 13457-13465
Published online Dec 28, 2015. doi: 10.3748/wjg.v21.i48.13457
Published online Dec 28, 2015. doi: 10.3748/wjg.v21.i48.13457
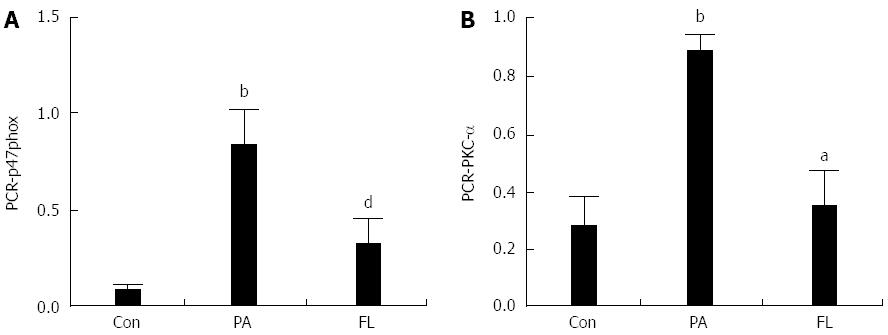
Figure 7 Effects of fenugreek lactone on mRNA levels of protein kinase C (A) and p47phox (B) in NIT-1 β-cells.
Each bar represents mean 2-ΔΔCT± SD (n = 3). bP < 0.01 vs control group; dP < 0.01 vs PA group; aP < 0.05 vs PA group. PA: Palmitate; FL: Fenugreek lactone.
- Citation: Gong J, Dong H, Jiang SJ, Wang DK, Fang K, Yang DS, Zou X, Xu LJ, Wang KF, Lu FE. Fenugreek lactone attenuates palmitate-induced apoptosis and dysfunction in pancreatic β-cells. World J Gastroenterol 2015; 21(48): 13457-13465
- URL: https://www.wjgnet.com/1007-9327/full/v21/i48/13457.htm
- DOI: https://dx.doi.org/10.3748/wjg.v21.i48.13457


