Copyright
©The Author(s) 2015.
World J Gastroenterol. Dec 21, 2015; 21(47): 13268-13276
Published online Dec 21, 2015. doi: 10.3748/wjg.v21.i47.13268
Published online Dec 21, 2015. doi: 10.3748/wjg.v21.i47.13268
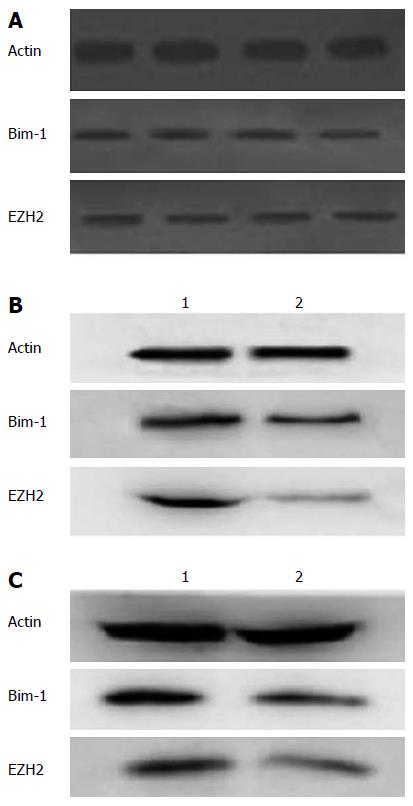
Figure 2 Western blot analysis of Bmi-1 and EZH2 protein levels.
A: Expression levels of Bmi-1 and EZH2 in HCC tissues and in normal tissues; B: Expression levels of Bmi-1 and EZH2 in Hep3B cells transfected with EZH2-shRNA or control vector. Lane 1 stands for the protein levels in Hep3B cells, and lane 2 stands for the protein levels in Hep3B cells transfected with EZH2-shRNA; C: Expression levels of Bmi-1 and EZH2 in Hep3B cells transfected with miR-203-shRNA or control vector. Lane 1 stands for the protein levels in Hep3B cells, and lane 2 stands for the protein levels in Hep3B cells with miR-203 overexpression.
- Citation: Yang F, Lv LZ, Cai QC, Jiang Y. Potential roles of EZH2, Bmi-1 and miR-203 in cell proliferation and invasion in hepatocellular carcinoma cell line Hep3B. World J Gastroenterol 2015; 21(47): 13268-13276
- URL: https://www.wjgnet.com/1007-9327/full/v21/i47/13268.htm
- DOI: https://dx.doi.org/10.3748/wjg.v21.i47.13268


