Copyright
©The Author(s) 2015.
World J Gastroenterol. Oct 21, 2015; 21(39): 11141-11151
Published online Oct 21, 2015. doi: 10.3748/wjg.v21.i39.11141
Published online Oct 21, 2015. doi: 10.3748/wjg.v21.i39.11141
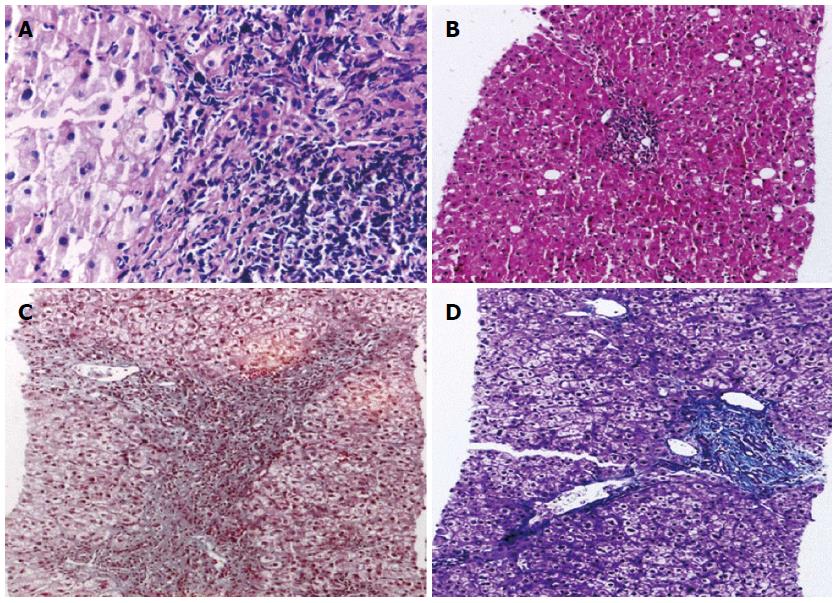
Figure 2 Histopathology of the liver biopsy tissues of patient group.
A: Hematoxylin-eosin (HE) stain showing Portal tract s with piecemeal necrosis; B: HE stain showing moderate portal inflammation, the hepatocytes shows mild steatosis; C: MassomTrichrom stain showing Portal tract with bridging fibrosis; D: MassomTrichrom stain showing fibrous expansion with septation.
- Citation: Naga M, Amin M, Algendy D, Elbadry A, Fawzi M, Foda A, Esmat S, Sabry D, Rashed L, Gabal S, Kamal M. Low-density lipoprotein receptor genetic polymorphism in chronic hepatitis C virus Egyptian patients affects treatment response. World J Gastroenterol 2015; 21(39): 11141-11151
- URL: https://www.wjgnet.com/1007-9327/full/v21/i39/11141.htm
- DOI: https://dx.doi.org/10.3748/wjg.v21.i39.11141


